Summary
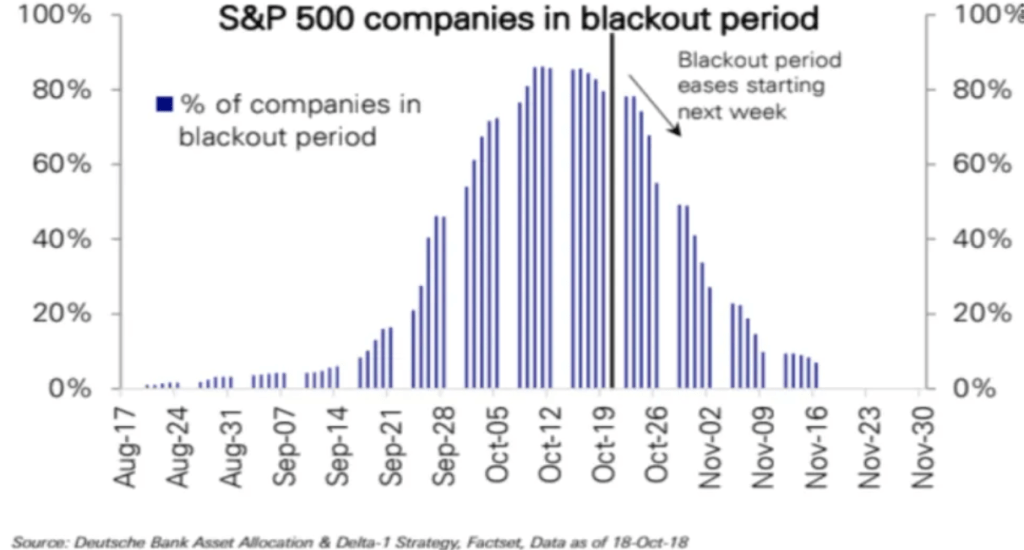
- Corporate buyback periods post-earnings tend to corroborate with seasonal rallies as liquidity is introduced into the market. On the contrary, drawdowns that occur during corporate buyback blackout periods tend to be extended, as corporate buybacks are a major source of liquidity.
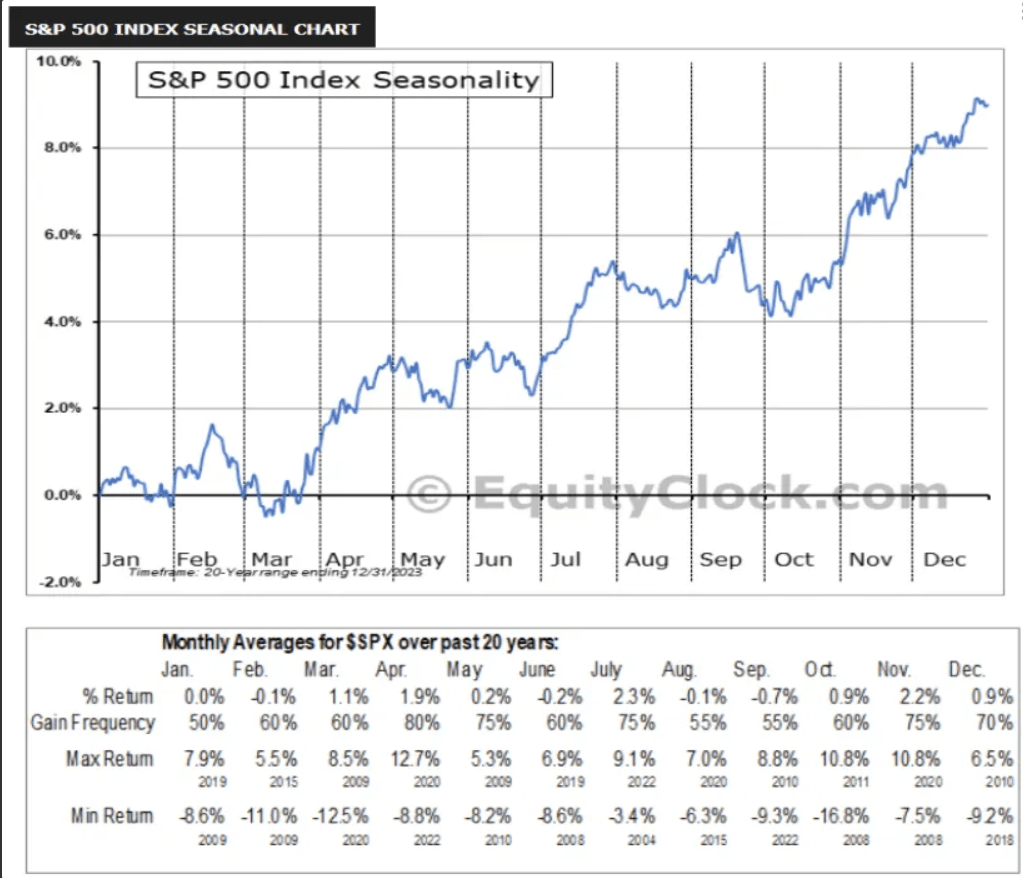
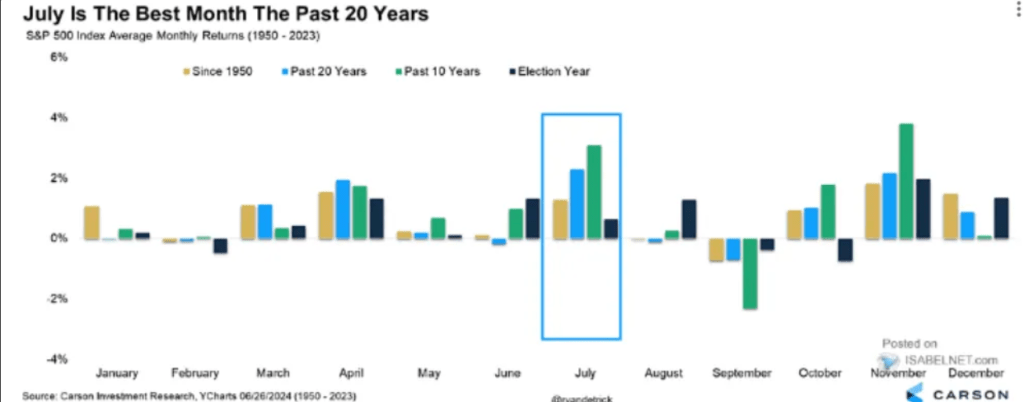
- July and November tend to provide the highest returns.
- Triple witching dates tend to corroborate with seasonal dips as traders are uncertain of new options/futures positioning, thus trimming their position.
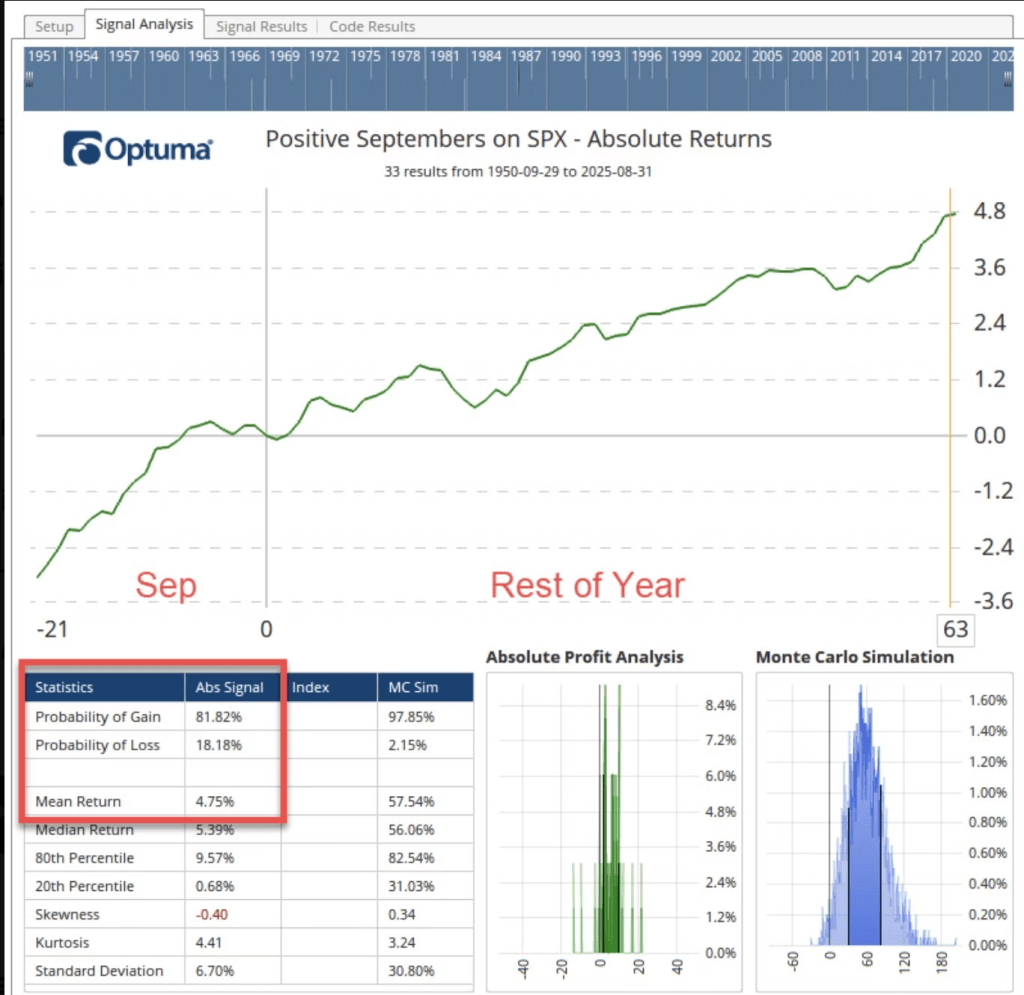
- September usually provides the worst returns. However, in months where September has a positive return, there is an 82% probability of a positive return throughout the rest of the year.
Feel free to read the rest of the data below:
What is seasonality?
Seasonality is the historical trends or patterns that recur over a yearly timeframe. This seasonality chart shows the averages over a 20-year period.
There are specific reasons why some months tend to outperform others, which we will cover below.
Corporate buyback blackout periods
The corporate buyback blackout period is the timeframe where companies are not allowed to “buy back” their own shares. This occurs 4x a year, prior to companies’ quarterly earning reports.
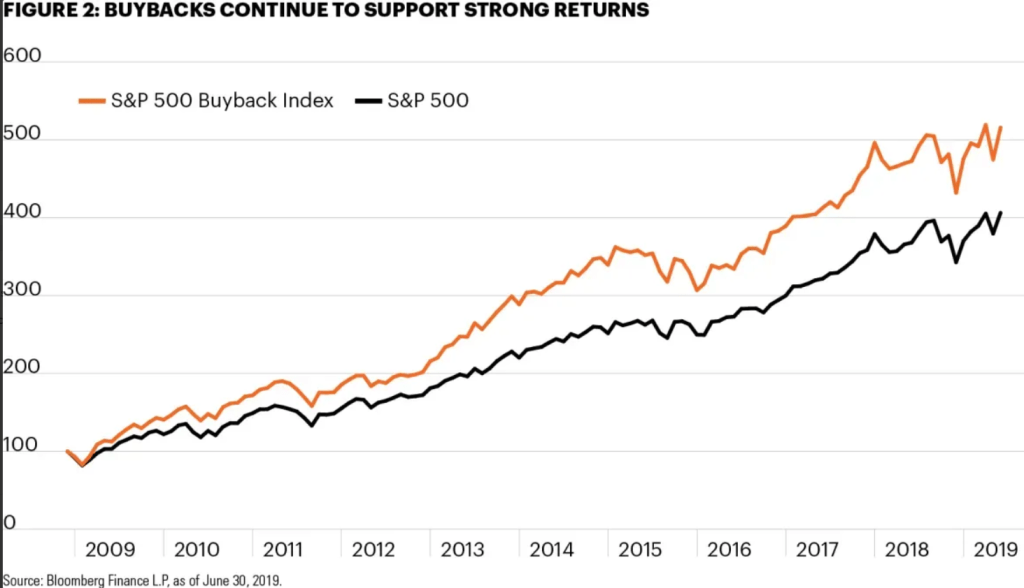
27% of SP500 returns are driven by corporate buybacks. This substantiates the significance of liquidity provided by corporate buybacks.
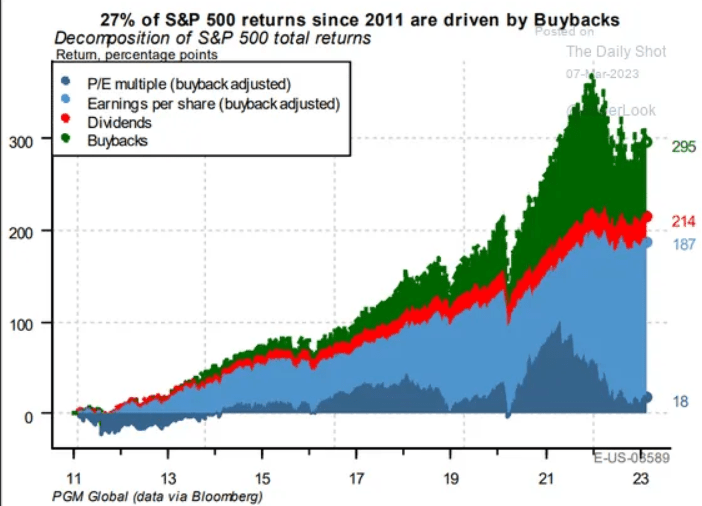
The SP500 Buyback Index, which tracks the top 100 stocks in the S&P 500 with the highest buyback ratios, significantly outperforms SP 500. The companies are acting as a massive buyer of its own stock, creating demand and thus liquidity in the market.
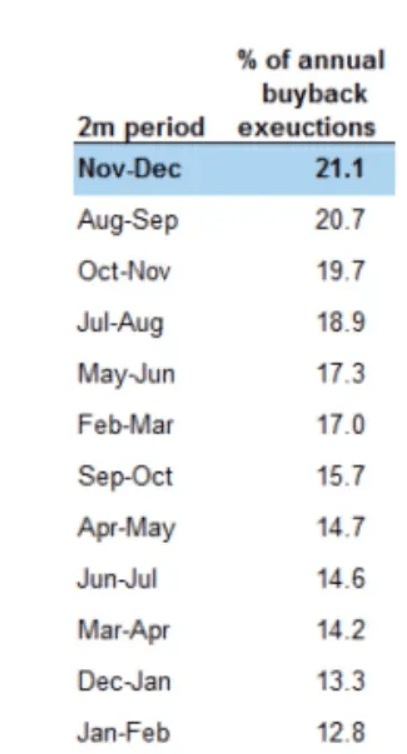
Corporate buybacks executed during Nov-Dec and Aug-Sep. In-line with the rally periods of Seasonality.
Triple Witching
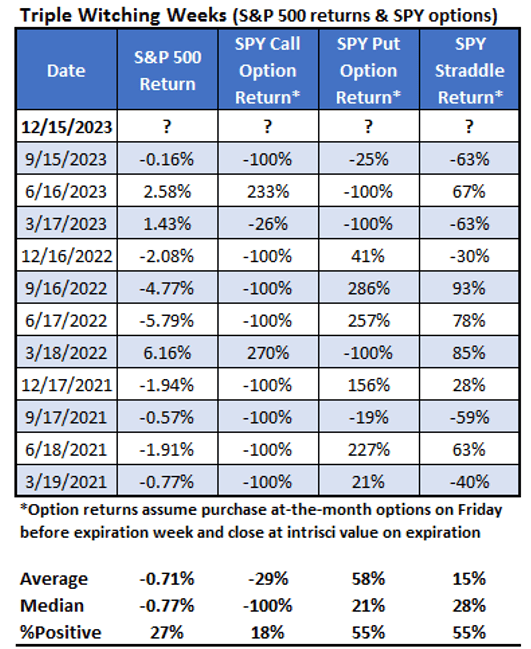
Triple witching is a quarterly event on the third Friday of March, June, September, and December when stock options, stock index futures, and stock index options all expire, causing increased volatility as traders close or hedge positions.
As you can see, triple witching weeks returned positive only 27% of the time.
Monthly performance
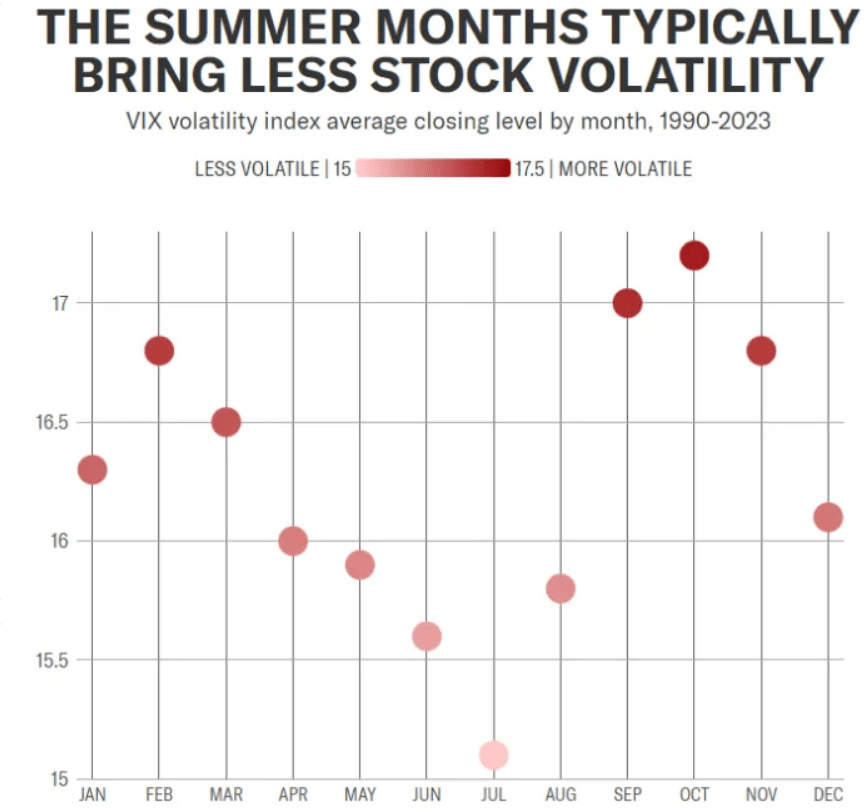
These are the average VIX levels for each month. July typically has the lowest volatility and best returns as traders go on break for summer vacation.
In months where September has a positive return, there is an 82% probability of a positive return throughout the rest of the year, with an average return of 5.3%.