This strategy anchors the bulk of my portfolio.
It is effortless, boring, yet incredibly effective.
Back testing over a 15-year period shows a staggering 4,879% return with a maximum annualized drawdown of just -19.47%.
It has comfortably netted me a 63% return within 2 years of implementation.
This page will provide a quick run-down on the essence of this strategy.
What are LETFs?
Leveraged Exchange-Traded Funds (LETFs) uses derivatives to multiply the daily returns of an underlying asset or index.
In other words, if S&P 500 delivers a 1% return:
•SSO (2x Leverage) would deliver a 2% return.
•SPXL (3x Leverage) would deliver a 3% return.
Conversely, losses are also multiplied.
What is volatility decay?
The general advice is to not hold LETFs over a prolonged period of time due to the concept of volatility decay.
Let’s assume a scenario where we have invested $100 individually into both SP 500(left column) and SPXL (right column).
Year 1 Results
| Ticker | SP 500 | SPXL (3x Leverage) |
| Initial Investment | $100 | $100 |
| Year 1 Performance | -20% | -60% |
| End of Year 1 Value | $80 | $40 |
Year 2 Results
| Year 2 Performance | +25% | +75% |
| End of Year 2 Value | $100 | $70 |
| Total Outcome | Break Even (0%) | Loss of 30% |
It’s evident that volatility decay demonstrates how LETFs can be problematic or ineffective in downtrends or choppy markets.
Where LETFs work extremely well, however, is during clear uptrends where drawdowns are limited and not a major concern.
Compare the following YTD gains of SP 500 vs SPXL during an uptrend:
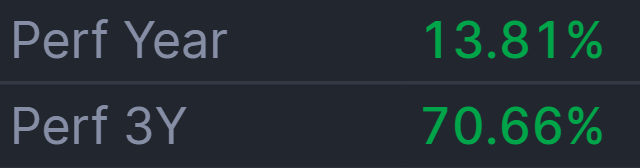
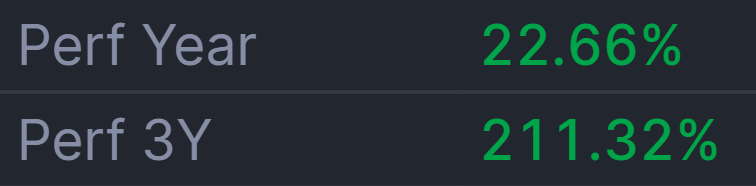
It’s clear that SPXL blows SP 500 right out of the water.
How to discern clear uptrends vs downtrends/chop?
This strategy will demonstrate when we should purchase SPXL and when we should sell SPXL.
Generally, common technical indicators such as MACD, SMAs etc. are what we call lagging indicators.
We can instead use a leading indicator that tracks the price of Credit Default Swaps, or CDS for short.
What are credit default swaps?
Let’s take a look at the following scenario:
1. Tan Bank lends $10 million to Huat Trading Co.
2. Tan Bank is worried that Huat Trading Co. might default or go bankrupt.
3. Tan Bank then goes to a third party insurer called Lim Insurance.
4. Tan Bank pays an insurance premium to Lim Insurance to insure their $10 million loan.
5. If Huat Trading Co. defaults, Lim Insurance must pay Tan Bank $10 million.
6. If Huat Trading Co. pays back the loan, Tan Bank makes money from the loan interest but loses the insurance premium paid to Lim Insurance.
The contract between Tan Bank and Lim Insurance is known as a Credit Default Swap, and allows Tan Bank to de-risk their loan.
BAMLH0A0HYM2
BAMLH0A0HYM2 is the name of the ticker used to track CDS Spread (the price of the premium in a CDS) in the economy.
It answers the question “Are companies at risk of going broke?”
This means BAMLH0A0HYM2 is more akin to a fundamental indicator of the economy rather than a technical one.
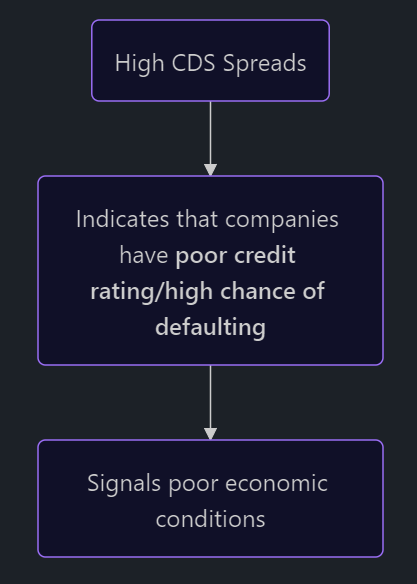
The higher a CDS Spread, the higher the likelihood of companies defaulting. This means that:
• When CDS spreads are low, economic conditions are good and is correlated with an uptrend.
•When CDS spreads is high, economic conditions are poor and is correlated with downtrends/chop.
| CDS | Economic Conditions | Trend |
|---|---|---|
| Falling/Low | Good | Uptrend |
| Rising/High | Poor | Downtrend/Chop |
It’s quite clear that we’d like to invest during periods where CDS is falling or low.
We can see the performance correlation between SP500 and inverse CDS Spreads below.
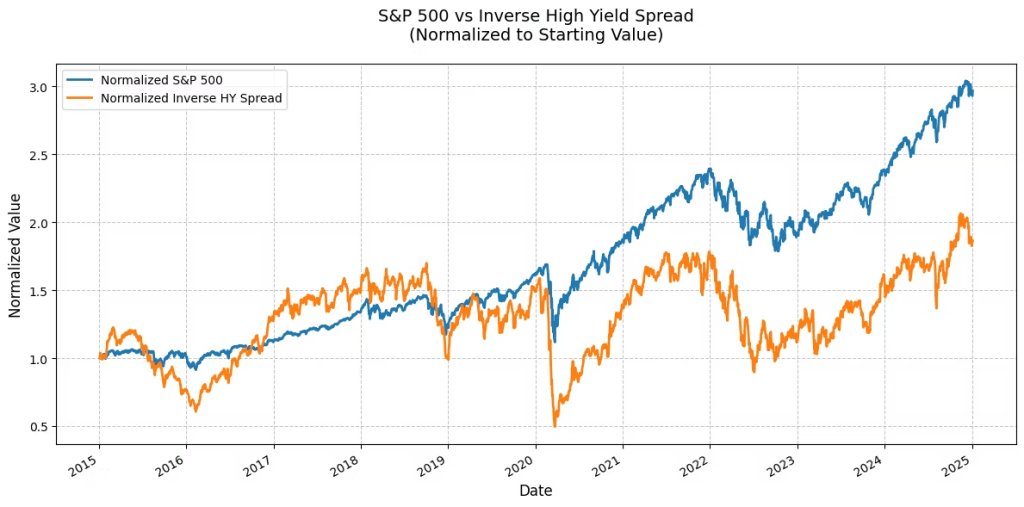
However, this begs the question – how do we know when exactly have credit spreads risen to the point where it signals an incoming downtrend or choppy market so that we’re able to get out in time?
Trigger Values
| Change % in CDS Spreads | Signal | Action |
|---|---|---|
| CDS rises >40% from recent low | Incoming downtrend/chop | Sell SPXL |
| CDS falls >35% from recent high | Incoming uptrend | Buy SPXL |
Back testing with 45/30 trigger values
If we plot these triggers on BAMLH0A0HYM2 into our charting software, it provides us with the dates in which SP500/SPXL was in an uptrend.
Assuming that our portfolio was entirely invested into SPXL during these uptrends, we can plot the following results:
Suppose an initial capital of $10,000
| Uptrend Dates | CAGR | Max Drawdown | Ending Value |
| 04 April 2003 – 13 April 2005 | 57.5% | -23.81% | $26,087.42 |
| 12 May 2006 – 19 July 2007 | 42.24% | -17.73% | $39,612.88 |
| 30 April 2009 – 04 August 2011 | 44.98% | -42.94% | $91.750.02 |
| 13 March 2012 – 09 October 2014 | 45.83% | -27.41% | $242,373.46 |
| 12 July 2016 – 05 December 2018 | 29.42% | -29.34% | $449,402.30 |
| 13 Dec 2019 – 26 Feb 2020 | -26.60% | -22.59% | $468,667.46 |
| 21 May 2020 – 14 Mar 2022 | 68.13% | -35.64% | $1,201,881.70 |
| 15 Jul 2023 – Present Day | 49.91% | -30.25% | $2,169,871.90 |
As we can see, this strategy grew our portfolio from an initial amount of $10,000 into $2,169,871.90 over a 20 year period!
In addition, we managed to avoid the massive market crash that occurred during the GFC and the Covid-19 pandemic.
If the volatility or drawdown of SPXL is too much to handle, I would suggest swapping over to SSO for 2x Leverage instead.
Optimising the trigger values
With a change from 45/35 to 30/30, the strategy manages to reduce its maximum annualized drawdowns to ~20% while maintaining its annualized gains.
| Change % in CDS Spreads | Signal | Action |
|---|---|---|
| CDS rises >30% from recent low | Incoming downtrend/chop | Sell SPXL |
| CDS falls >30% from recent high | Incoming uptrend | Buy SPXL |
Back testing with 30/30 trigger values
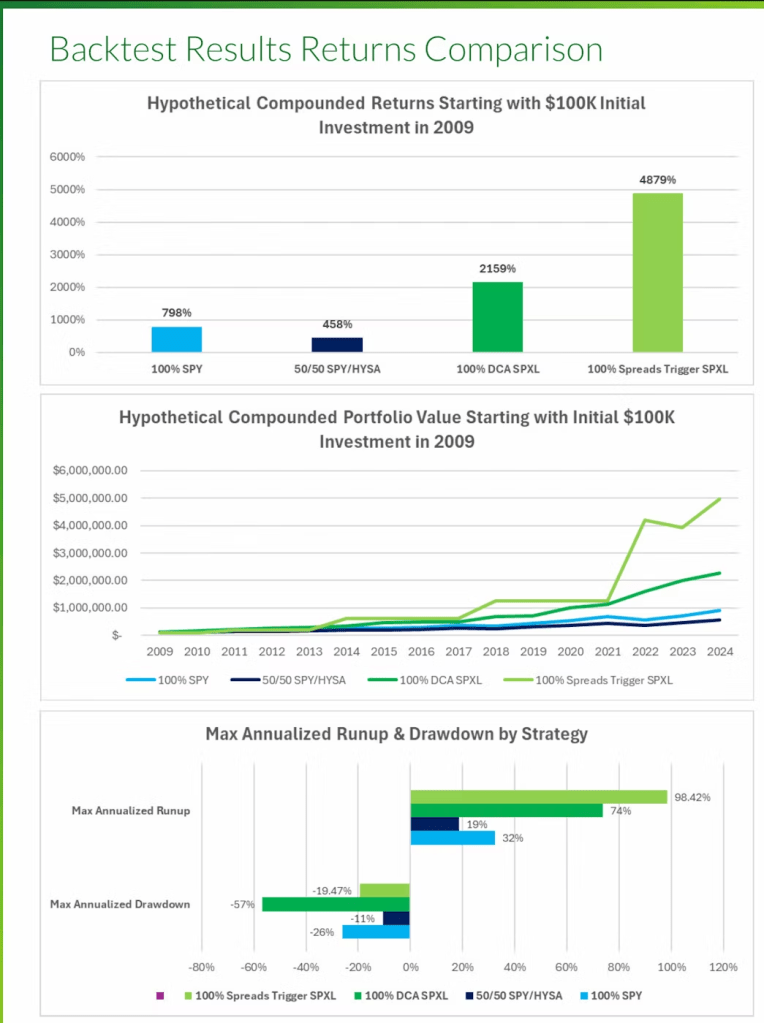
As seen in the image above, this strategy provides the largest annualized gain while also maintaining an annualized drawdown lower than holding SP500.
Impact of DCA on strategy performance
Presume a principal amount of $10,000, beginning from 2009.
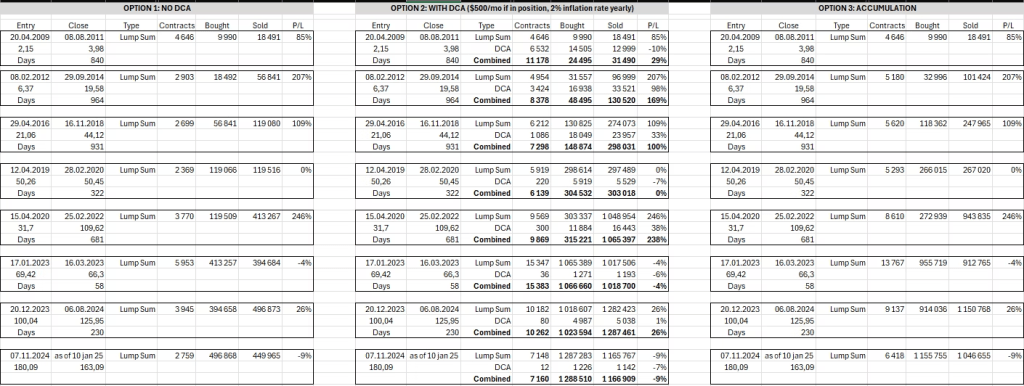
Results
Option 1 (No DCA): $450k
Option 2 (DCA during uptrend): ~$1 Million
Option 3 (Lump sum in beginning of next uptrend): ~$1 Million
There are no significant difference between Option 2 vs Option 3, however the concept of DCA significantly affects the return in comparison to Option 1.
Final note
This strategy assumes that you are passively holding SPXL without selling during an uptrend.
You are, of course, free to trim profit to raise cash and use said cash to buy dips.
The real gem here is the CDS Spread Indicator. It confirms that the economy is resilient and that we are in an uptrend, allowing us to “buy the dip” with conviction, which makes active investing much safer.
