To determine whether a stock will rise, our goal is to analyze and gather as much positively aligned data as possible to maximize our likelihood of success.
This is also known as confluence.
We can sort our data in this priority:
- News & Risk Events
Headwinds, major news drop, or VIX spike events supersedes everything and can invalidate our technical and data analysis in an instant.
2. Fundamental Analysis
Market environment dictates the likelihood of success. Trading in a healthy, high-liquidity market will naturally boost your win rate compared to fighting a choppy or bearish market as drawdowns are minimized and upside will be higher.
In terms of company fundamentals, never allocate capital unless you fundamentally agree with the company’s underlying financial health and long-term thesis.
3. Data and Technical Analysis
Finally, these data points allow you to pinpoint exactly which stocks institutions are targeting for future upside.
Now let us translate these concepts into actionable strategies.
News and Risk Events
Before analyzing any charts or data, we must first verify that there are no systemic risk events such as geopolitical uncertainty, headwinds, major news drops, or a violent spike in VIX.
You could possess the highest probability setup in the world, but an exogenous event such as a Fed rate hike can easily crush your setup due to the underlying shift in the macro environment. Remember, macro environment supersedes everything.
For the practical examples in this guide, we will assume clear skies and a perfectly healthy macro environment.
Market Fundamentals
Next, let’s assess the health of the market.
CDS Indicator BAMLH0A0HYM2
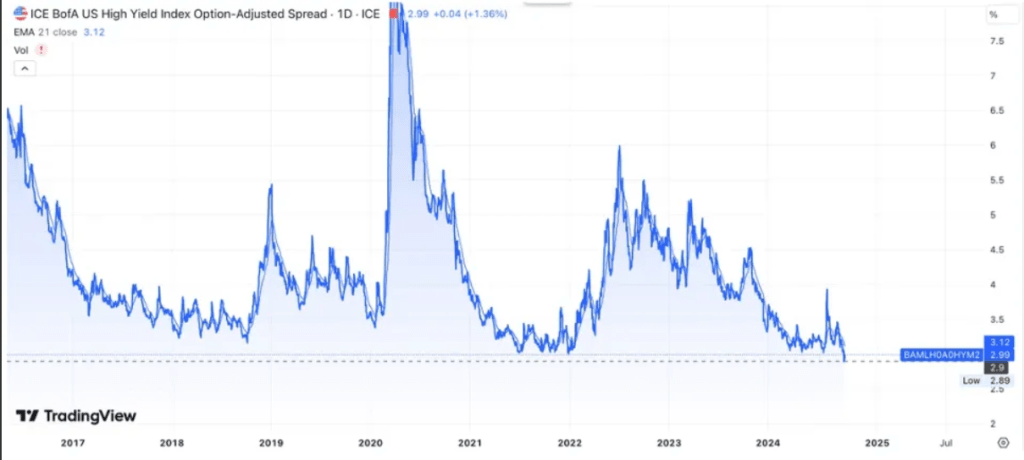
BAMLH0A0HYM2 is a fundamental indicator. You can read more about this at Credit Spreads Strategy.
In this example, the credit default swaps is currently below my exit value, which shows a resilient economy.
Market Breadth
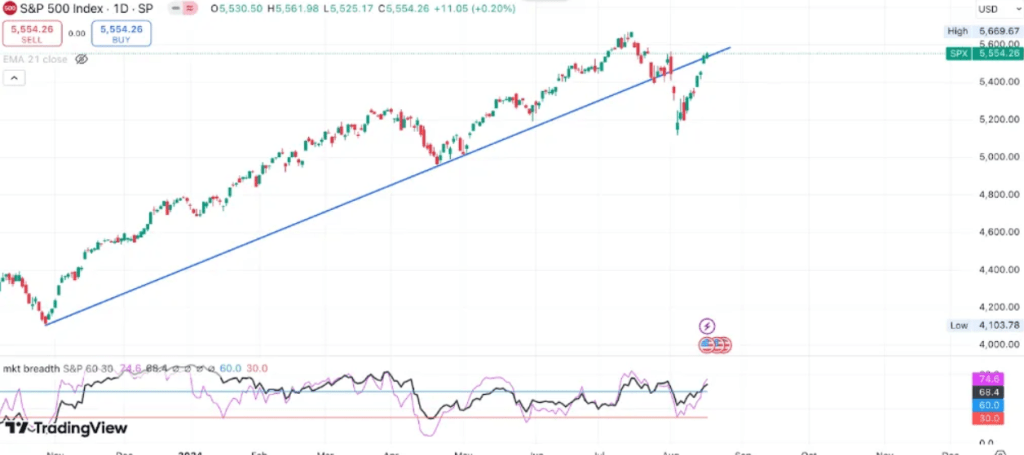
If the market breadth indicator is low, it’s a sign that the economy is doing poorly and that a single sector is carrying the S&P 500 as a whole.
In this example, market breadth is high and diversified.
SMA
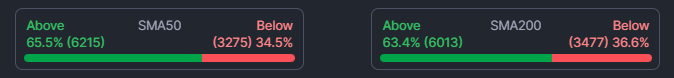
Although SMA is a lagging indicator, it helps to identify momentum.
S&P 500 above SMA: upward momentum
S&P 500 below SMA: downward momentum
In addition, the more individual stocks trading above their SMA, the healthier and more resilient the overall market breadth.
In this example, we can see that 65.5% of stocks in the S&P 500 are trading above their 50d SMA, indicating healthy momentum and breadth.
Advance/Decline Line
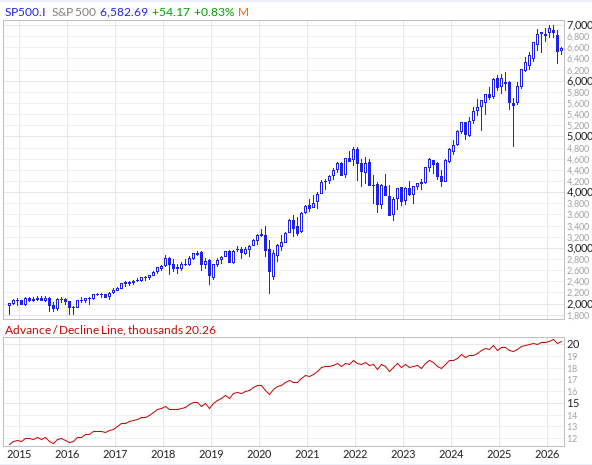
Every day, the A/D line calculates a simple score:
No. of stocks that went up minus no. of stocks that went down.
If 300 stocks went up and 200 went down, today’s net score is +100, and that 100 is added to yesterday’s A/D line.
If the S&P 500 is rising, but the A/D line is dropping, it means the index is poorly diversified. The index is propped up by a single sector while majority of normal stocks are performing poorly.
If the S&P 500 is rising, and the A/D line is rising, it is confirmation that the rally is strong and diversified.
In this example, we can see S&P 500 rises along with the A/D line, confirming a healthy and diversified rally.
VIX
Generally, standard market conditions will have a VIX value of 15 – 20 where healthy pullbacks occur, but there is no widespread panic.
Here is a table of different VIX values, as composed by Gemini:
| VIX Level | Market Environment | Key Characteristics |
|---|---|---|
| < 12 | Extreme Low / Complacency | Extremely calm. Almost no demand for hedging (Put options). Market is grinding higher but vulnerable to surprise shock catalysts. |
| < 15 | Low Volatility | Confident and highly liquid. Typically a Long Gamma environment resulting in a slow, steady “grind higher” with very shallow pullbacks. |
| 15 – 20 | Normal / Moderate | Standard trading conditions. Healthy, normal pullbacks occur without widespread panic. |
| 20 – 30 | Elevated Volatility | Fear is entering the market. Expect choppy 1% to 2% daily price swings. This is the zone where Short Gamma environments usually ignite. |
| > 30 | High Volatility / Panic | Major market corrections or crashes. Investors are aggressively buying Put options to protect their portfolios at any cost. |
In this example, let’s assume a normal volatility level.
After the above assessment, we’ve determined that the market is indeed healthy and well diversified.
Company Fundamentals
Next, we need to choose a company where we fundamentally agree with the company’s underlying financial health and long-term thesis.
I won’t cover too much into this as company research can easily be conducted through the use of AI. In any case, here is a quick table on the factors to consider, as composed by Gemini:
| Pillar | What “Fundamentally Sound” Looks Like |
|---|---|
| 1. Financial Health | Debt-to-Equity Low (< 1.0): The company uses more of its own money than borrowed money to fund operations. Current Ratio Healthy (> 1.5): The company has more than enough short-term assets to cover its short-term liabilities. |
| 2. Profitability | Revenue & EPS Growth Consistent: Steady year-over-year growth (e.g., 8-15%+) without wild, unpredictable swings. Free Cash Flow (FCF) Positive & Growing: The company consistently generates a surplus of actual cash after paying all its operating and capital expenses. |
| 3. Economic Moat/Competitive Advantage | High market share, strong pricing power, or a product that is extremely difficult for customers to stop using (high switching costs). |
| 4. Management | Return on Invested Capital (ROIC) High (> 15%): Management is exceptionally efficient at turning the money invested in the company into highly profitable returns. |
| 5. Valuation | Forward P/E & P/FCF Reasonable: The multiples are lower than or in line with their main industry competitors and historical averages. PEG Ratio Near 1.0: The price you are paying is perfectly justified by the company’s expected growth rate. |
| 6. Popular | In the event of a dip, there would be a sizeable amount of buyers to purchase the dip quickly. This reduces the length of drawdown. |
At the minimum, you must have the long-term confidence in holding the company and averaging down if an extended drawdown occurs.
Data Analysis
After verifying that both market and company fundamentals are solid, we can move onto Data Analysis.
For a deep dive into the methods of Data Analysis, read my complete breakdown here:
Technical Analysis
I have detailed the exact technical analysis methods I use to identify these setups. You can read the full breakdown here:
We will be using the breakout analysis for our next example.
Putting into practice
Let’s utilize what we have learnt so far into actual application.
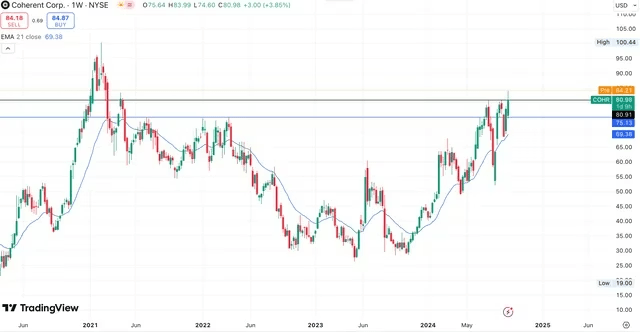
Technical-wise, we see that COHR currently has a clear horizontal resistance at $80.
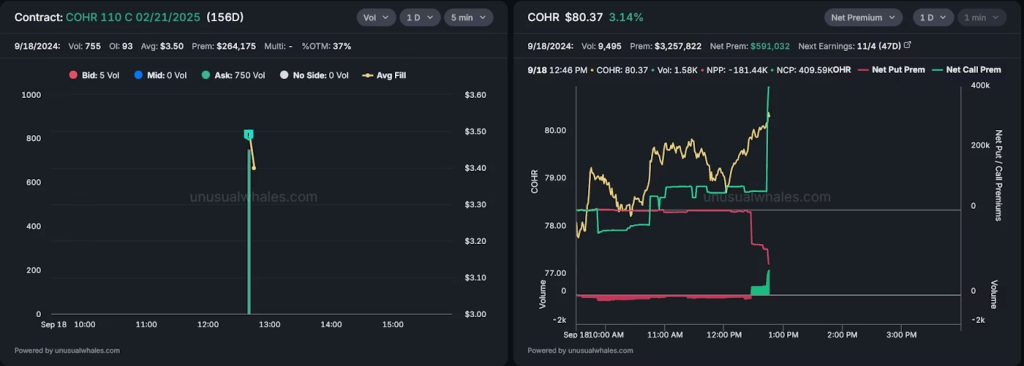
Next, we see a sizeable $264,175k call that is 37% OTM, 156 DTE. The net premium is $591,032, and we’d ideally like to see consistent bullish flow while we are tracking COHR. So far so good.
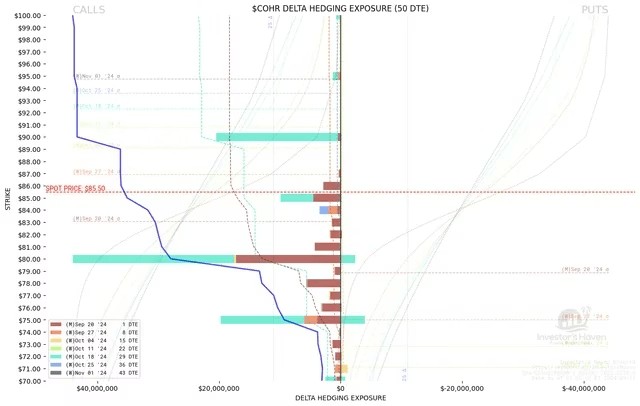
An extremely bullish outlook on the GEX chart. OTM call node of $90 (price target), and ITM call node of $80 (support).
We are now currently waiting for the price to break out of the resistance.
Once the chart breaks out and closes above, it’s our confirmation to enter.
At this point, the fundamentals, data, and technical data points are all positively aligned. It is a high probability bet that we will see upside.
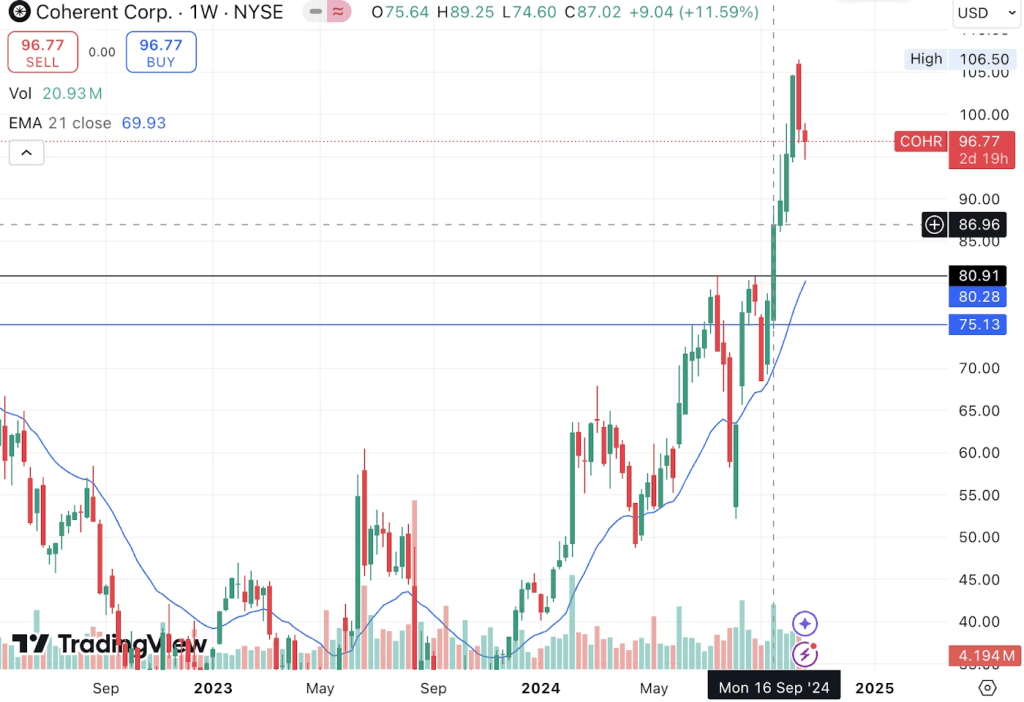
The stock ends up rallying from $80 to a whopping $106.
You can trim at $90 as that was our initial profit target, and and leave the rest to run due to the lack of ITM put nodes above $90 (lack of resistance).
