This strategy is mainly used to identify when exactly does momentum shift – it identifies entry signals when momentum shifts upwards, and exit signals when momentum shift downwards.
Or to put it simply, it allows us to spot trend reversals before they occur.
Note that this approach carries a significantly higher accuracy on higher timeframes.
Again, confluence is the name of the game. Combine this with your broader market analysis to maximize likelihood of success.
Indicators
Let’s break down the specific indicators that make this strategy work.
This is used to identify high volatility breakouts in either direction. The TTM squeeze doesn’t tell us which direction it will break, so we need to pair it with a momentum oscillator to gauge the direction.
This is similar to RSI and used as a momentum oscillator.
| Bullish | Bearish |
|---|---|
| Stochastic breaks above 20 | Stochastic breaks below 80 |
| Stochastic fails to reach 20 on an down move | Stochastic fails to reach 80 on an up move |
3. MACD-H
The MACD-H allows you to spot when the momentum of the stock is diminishing, even if the price hasn’t dropped yet, and vice versa. This essentially allows you to predict the price action before it occurs.
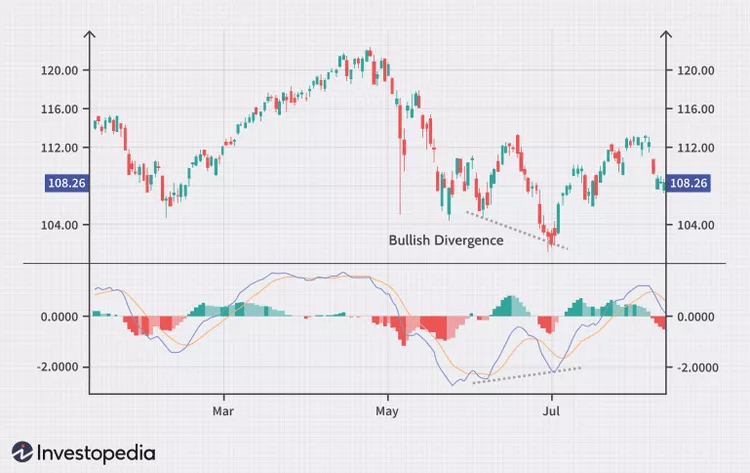
Bullish Divergence
The price forms lower lows, but the MACD forms higher lows. This suggests increasing momentum and a potential for trend reversal upwards.
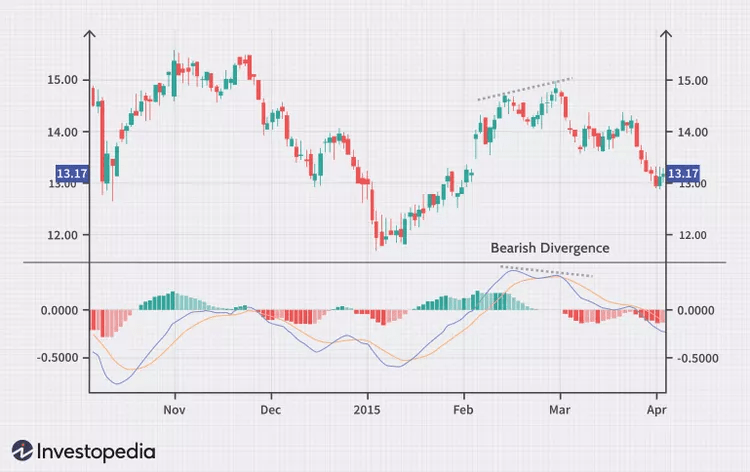
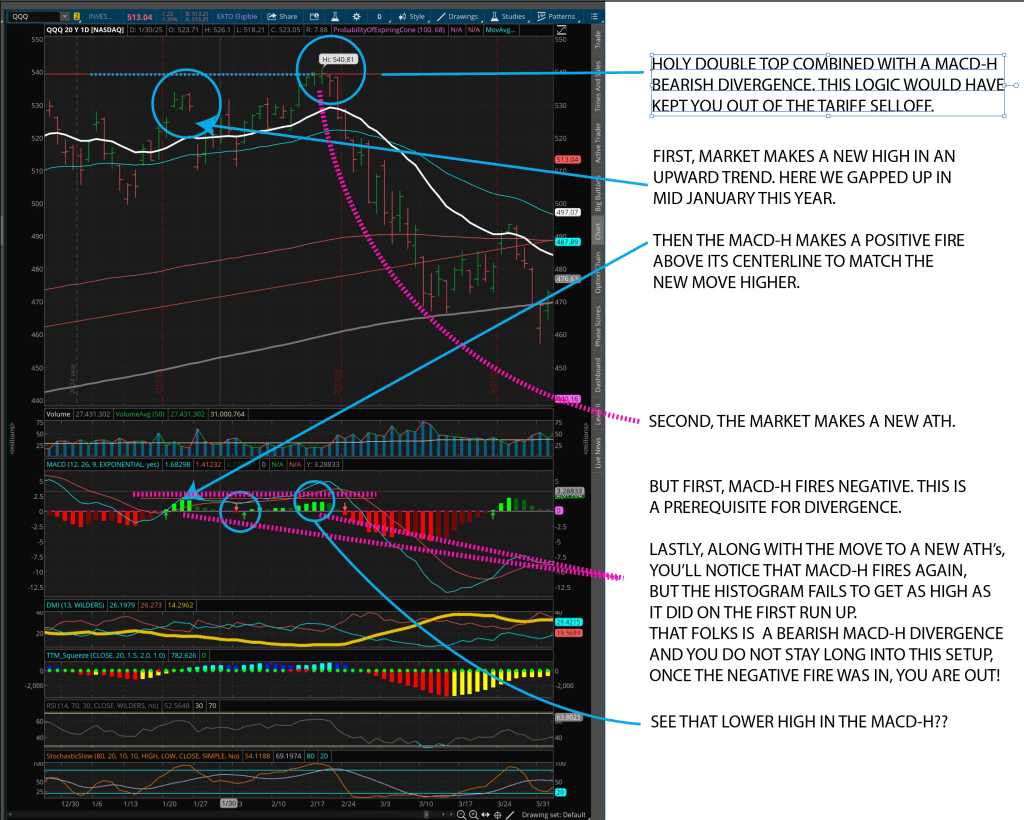
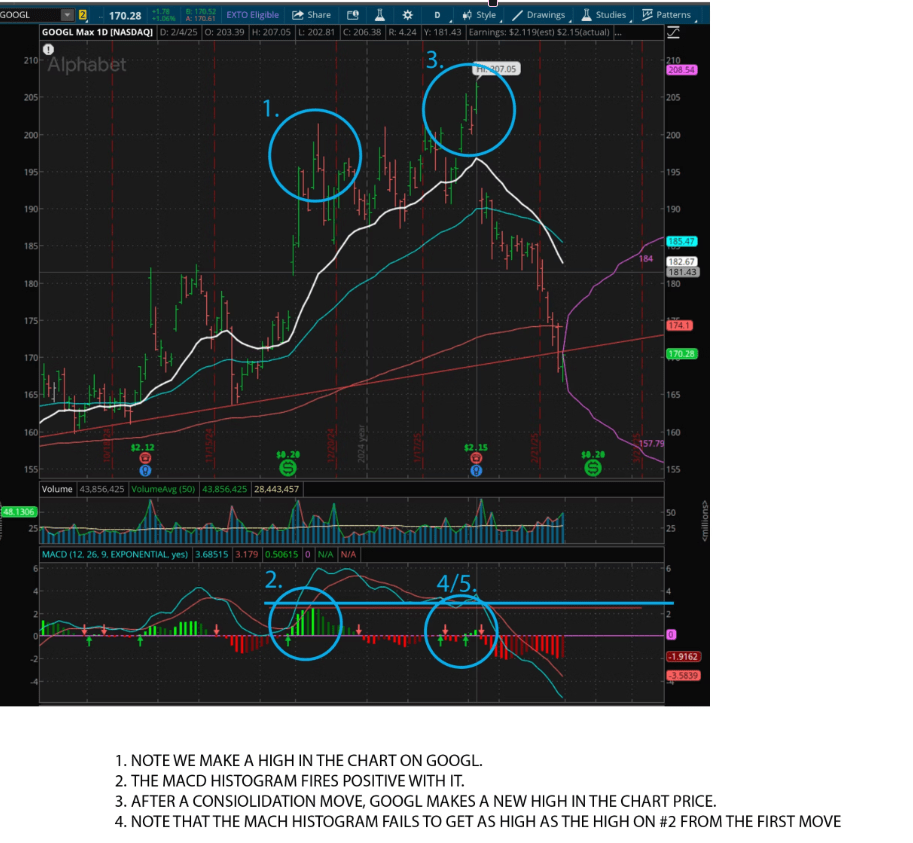
Bearish Divergence
The price forms higher highs, but the MACD forms lower highs. This suggests weakening momentum and a potential for trend reversal downwards.
Buy Signals
| Buy Signals |
|---|
| RSI >50 and Rising or Oversold |
| MACD-H Bullish Divergence and Positive Crossover |
| MACD-H Below 0 Line |
| TTM Squeeze Positive |
| Stochastic Breaks 20 |
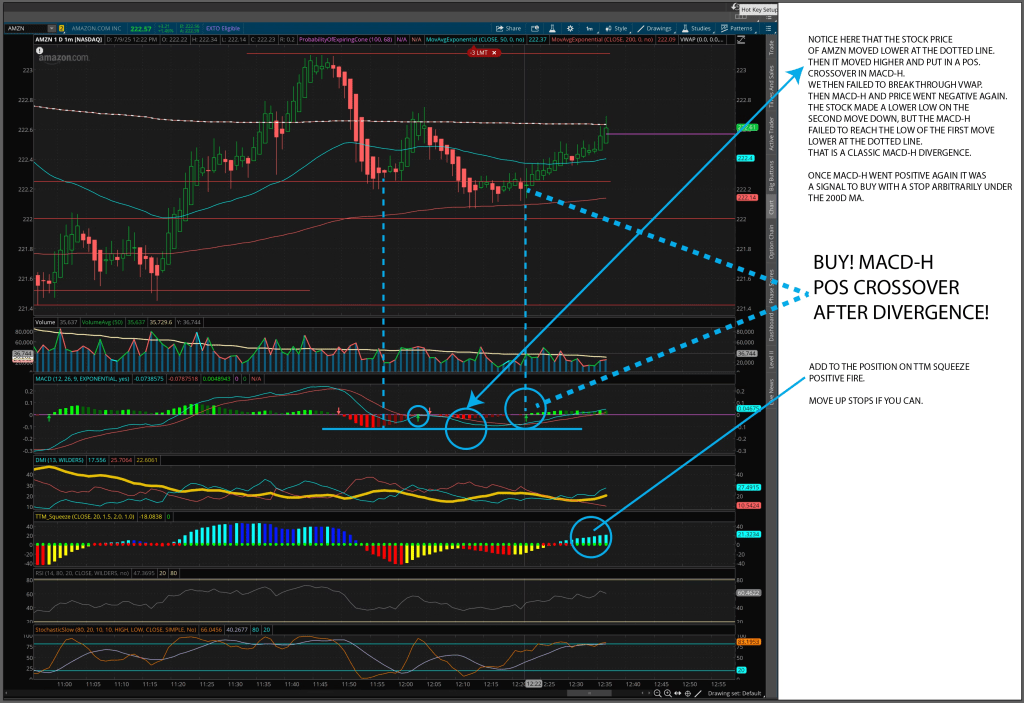
Generally, MACD-H will be our main buy signal to indicate a trend reversal:
- MACD-H Bullish Divergence and Positive Crossover
- MACD-H Below 0 Line
We normally enter once we have spotted a bullish divergence, the MACD-H remains below the 0 line, and finally once a positive crossover occurs.
However, this strategy is most accurate when other buy signals are used to complement our main signal:
- TTM Squeeze Positive
- Stochastic Breaks 20
- RSI >50 and Rising or Oversold
Let’s look at a few case studies where this has occurred. You’ll note that the majority of the examples are in the daily timeframe. Longer timeframes like weekly and monthly works even better.
Sell Signals
| Sell Signals |
|---|
| RSI Overbought and Dropping |
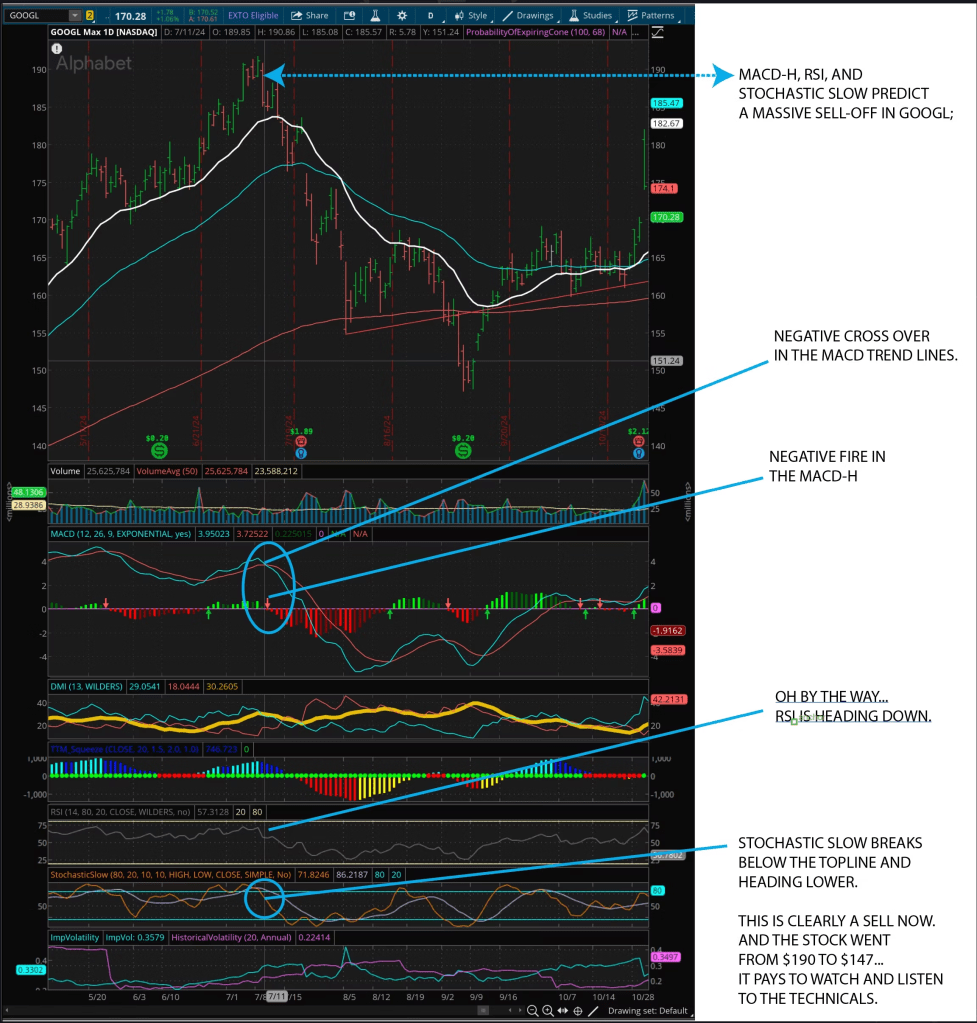
| MACD-H Bearish Divergence and Negative Crossover |
| Stochastic Breaks 80 |
| TTM Squeeze Downward Sloping |
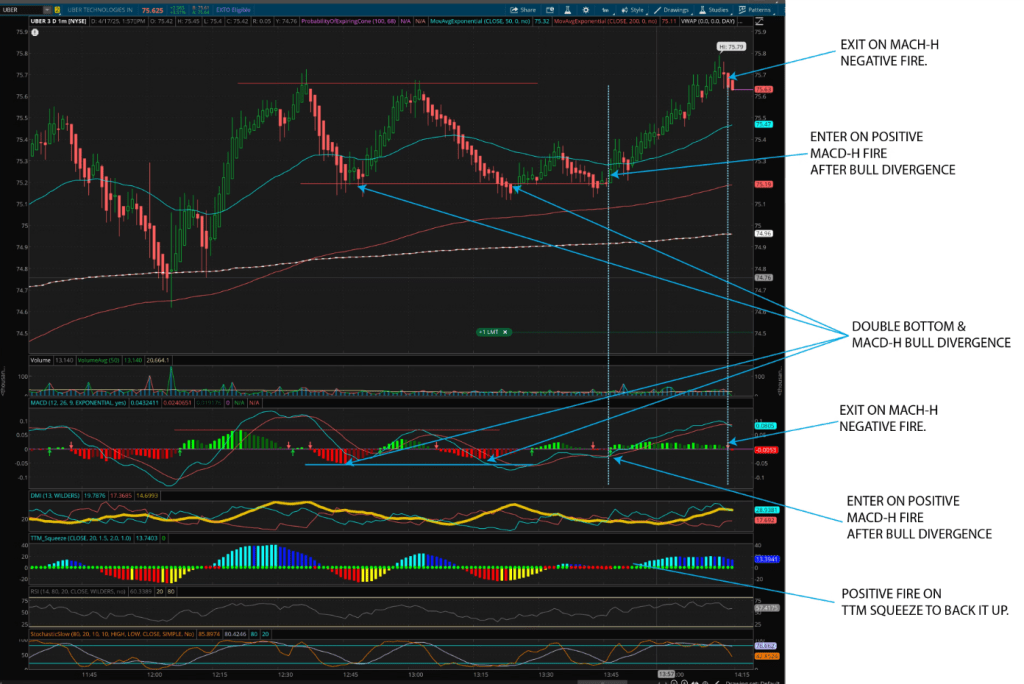
As with before, MACD-H will be our main sell signal and other sell signals are used to further confirm our strategy.
We normally exit once we have spotted a bearish divergence and once a negative crossover occurs.
TTM Squeeze, RSI, and Stochastic is used as confirmation signals.
Even without the bearish divergence, a reversal can still be predicted if all the sell signals align, as seen in the examples below.

(This next picture assumes we have shorted the stock, and are entering on a negative crossover)
Stochastic Slow leads
Stochastic Slow acts as a leading indicator for MACD-H.
Buy Signal Process
- Stochastic Slow must first break above 20 before a MACD-H positive crossover can occur.
- MACD-H positive crossover occurs.
- TTM positive squeeze occurs.
Sell Signal Process
- Stochastic Slow breaks below 80. There is approximately a 3 day lag between Stochastic breaking below 80 and TTM squeeze sloping downwards.
- TTM squeeze slopes downwards.
- MACD-H negative crossover occurs.
