Mid-Term Election Year
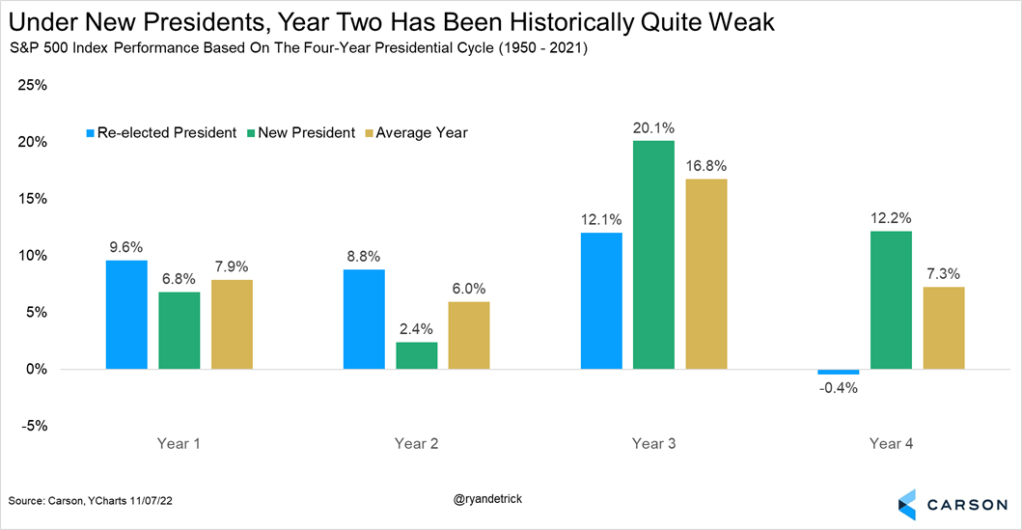
The presidential election cycle theory historically sees the mid-term election year as the weakest year due to increased volatility from political uncertainty.
Let’s take a look at mid-term year seasonality on a more granular basis.
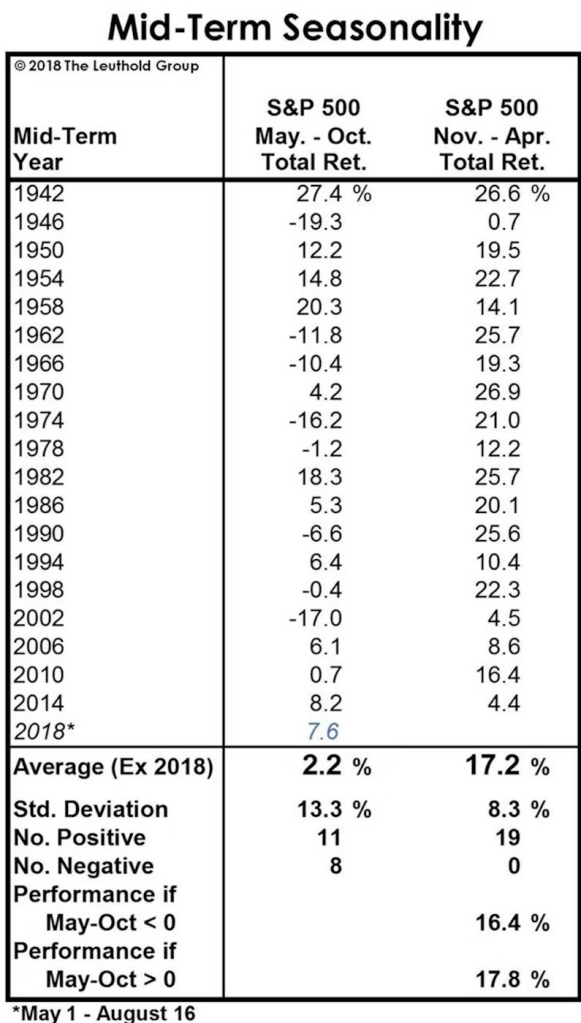
Before Midterms (May – Oct): Down 8 out of 19 times
After Midterms (Nov – Apr): Up 19 out of 19 times.
A high probability bet is to prepare for volatility before the midterms by allocating a higher % of cash, and redeploying that cash in the November – April post midterm period which has shown strong average returns of 17.2%.
S&P 500 suffers an average intra-year drawdown of -18%, so we shouldn’t be in hurry to buy small dips on S&P 500 during this period of heightened volatility.
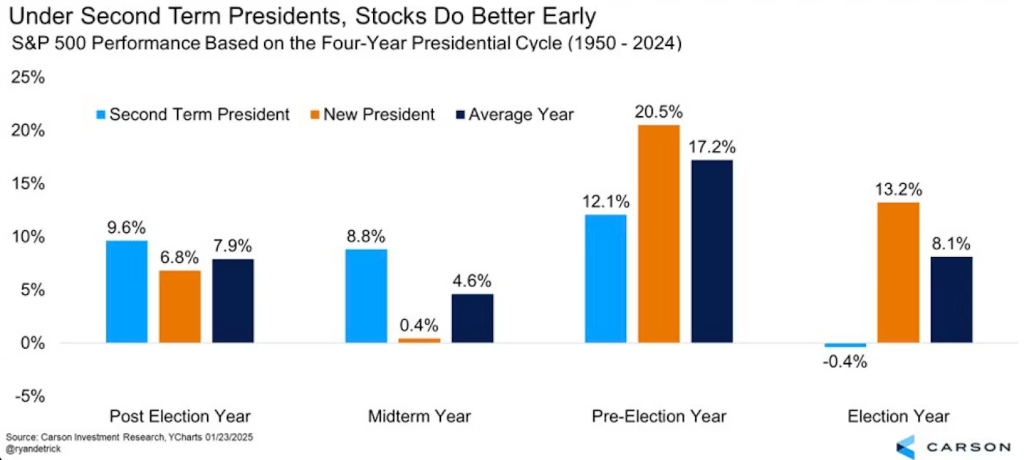
If we narrow down the dataset down to 2nd term presidents, we can see that midterm years tend to perform better with an average 8.8% gain.
Let’s take a look at the Federal Reserve’s monetary policy to provide context into the performance of 2nd term presidents:
| President | Monetary Policy | Performance |
|---|---|---|
| 1958 Dwight D. Eisenhower | Cuts | 38% |
| 1966 Lyndon B. Johnson | Hikes | -13% |
| 1974 Richard Nixon | Hikes | -29% |
| 1986 Ronald Reagan | Cuts | 14.6% |
| 1998 Bill Clinton | Cuts | 27% |
| 2006 George Bush | Slow Hike | 14% |
| 2014 Barack Obama | Pause | 12% |
We can see that the 2 negative years were during clear hiking cycles. Assuming a dovish fed, cutting cycles have always delivered positive returns for the midterm year.
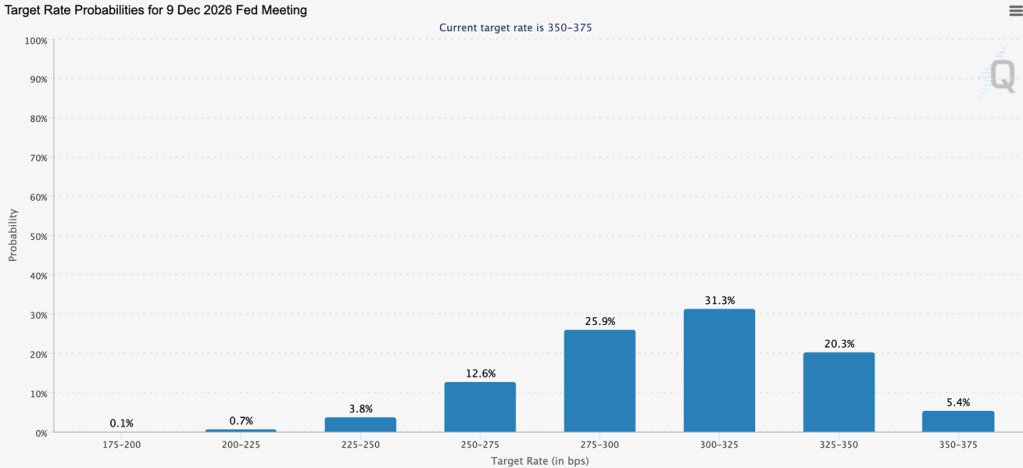
We are currently priced for rate cuts into 2026. However, a significant spike in inflation could force the Fed to swap from rate cuts to rate hikes.
As such, monetary policy plays an important role on how this mid-term year will shape out.
Here are the general threshold values that separate hawkish from dovish territory, as composed by Gemini:
| Metric | The Fed’s Target | 🦅 Hawkish Zone (Hikes / Pauses) | 🕊️ Dovish Zone (Rate Cuts) |
|---|---|---|---|
| Core PCE (Inflation) | 2.0% | > 2.5% (Especially if rising or sticky) | < 2.5% (And trending downward) |
| Unemployment Rate | ~4.0% | < 4.0% (Labor market is too tight) | > 4.2% (Especially if rising rapidly) |
| Wage Growth (YoY) | ~3.0% – 3.5% | > 4.0% (Risks a wage-price spiral) | < 3.5% (Aligns with 2% inflation) |
| JOLTS (Openings per Worker) | 1.0 to 1.2 | > 1.3 (Too many open jobs, driving up pay) | < 1.0 (More unemployed than open jobs) |
| GDP Growth | ~1.8% – 2.0% | > 2.5% (Economy is running too hot) | < 1.0% (Recession risk) |
Rate Cuts
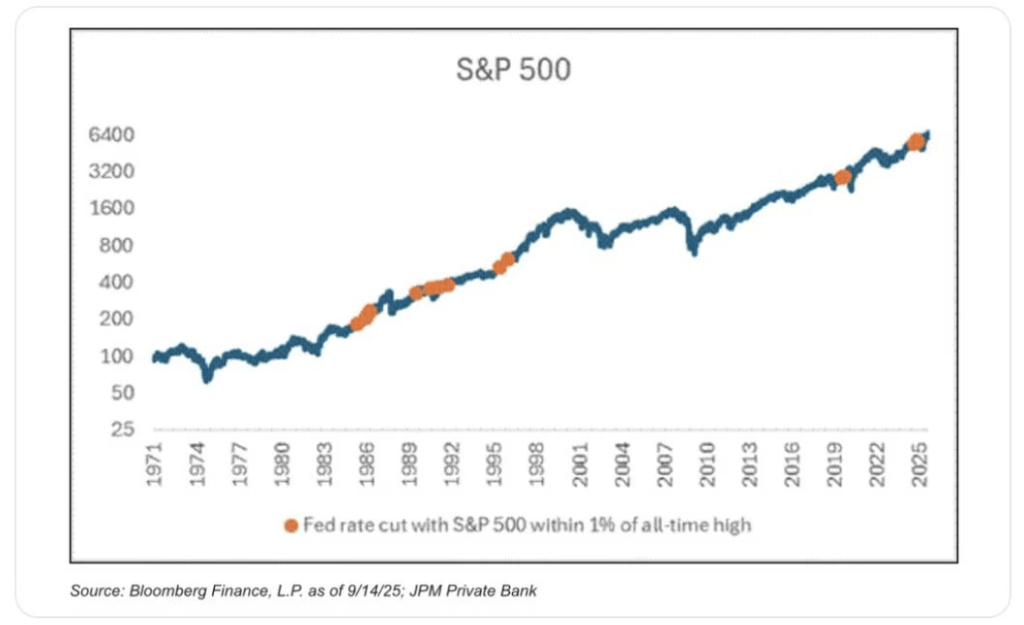
JPM’s study shows that whenever the Fed has cut rates within 1% of ATH of S&P 500, S&P 500 was up higher a year later every single time with an average return of 15%.
In September 2025, the Fed has cut rates within 1% of its ATH. S&P 500 was trading at 6600 at the time, and extrapolating an average return of 15% would project a 12-month target of 7590.
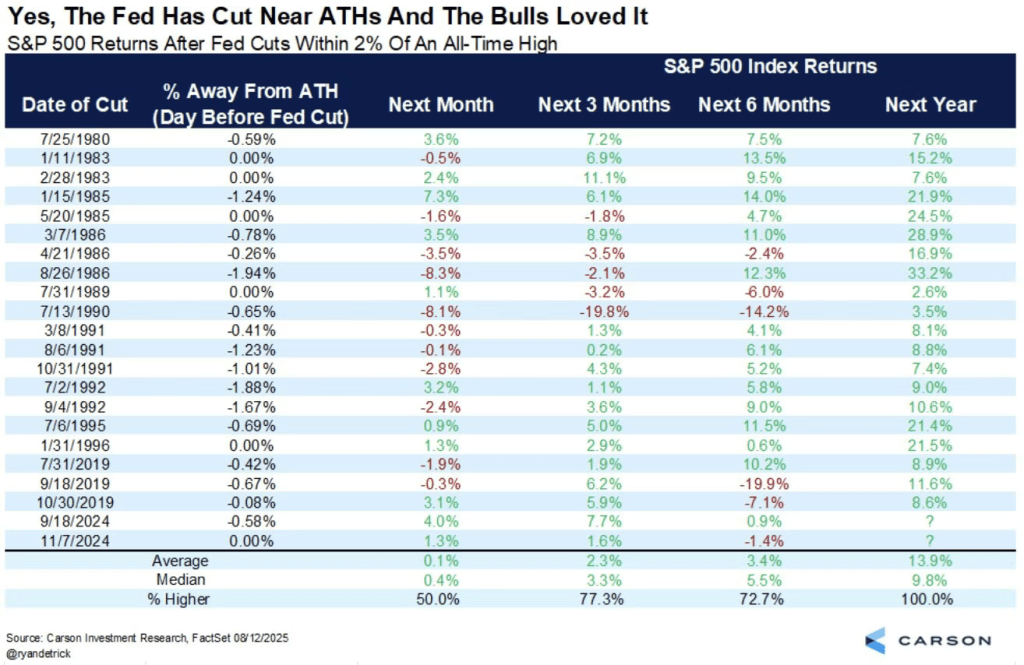
If we broaden the data to rate cuts within 2% of ATH, we can see while there is variability between the 6 month returns. However, the 12 month returns were positive in all cases.
While we cannot be certain we will hit the 12-month target of 7590 as it is just an average, it is a high probability bet that the market will be greater than 6600 by September 2026.
This implies that any dip below 6600 would be a great buying opportunity.
Turn of the Year
The Turn of the Year study shows that S&P 500 performance between November 19 and January 19 is a strong predictor for the year ahead.
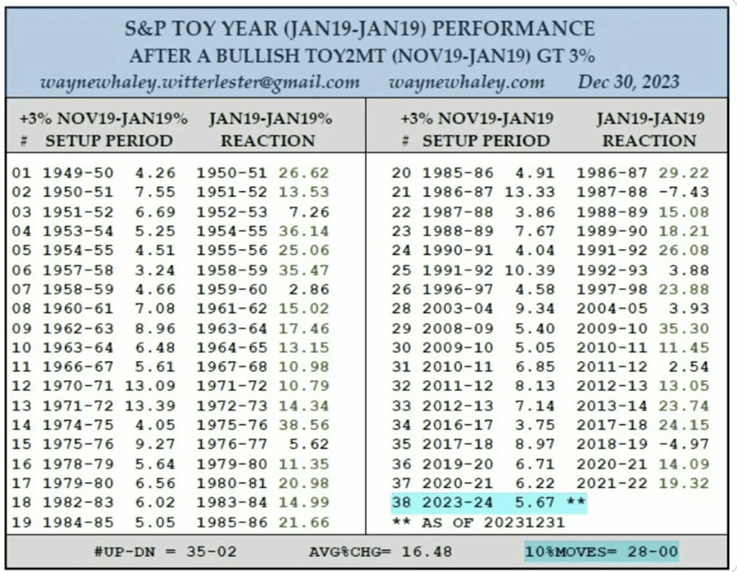
Whenever S&P 500 is up 3% within November 19 and January 19, the period ahead from January 19 to January 19 Next Year yields a positive return 35 out of 37 times, dating back to 1950.
From 19 Nov 2025 to 19 Jan 2026 yielded a gain of 4.84% on the S&P 500, making it a high likelihood of a positive year.
Recessionary Risks
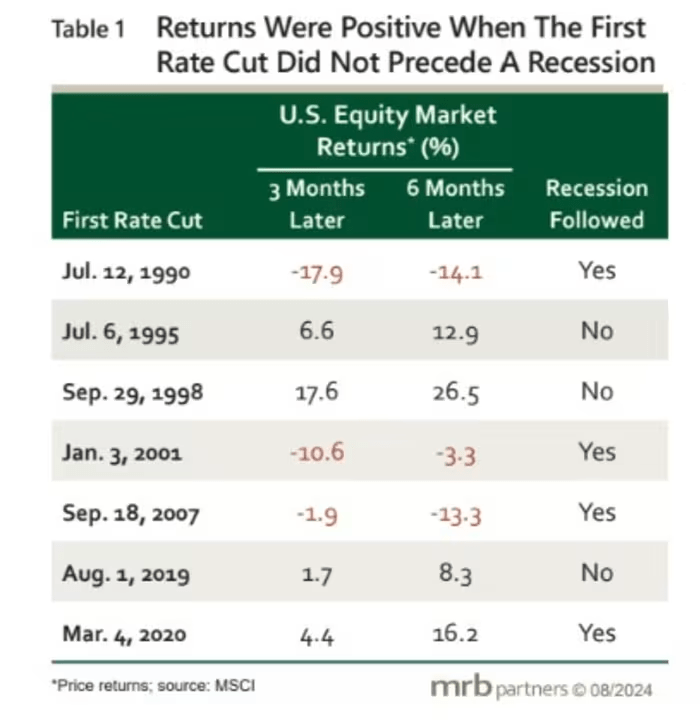
When interest rates are cut and followed by the onset of a recession, forward returns were always negative.
When interest rates are cut and not followed by the onset of a recession, forward returns were always positive.
This makes the recessionary risk a crucial factor to track during cutting cycles.
- Currently, BOA forecasts a 2.4% real GDP Growth for 2026.
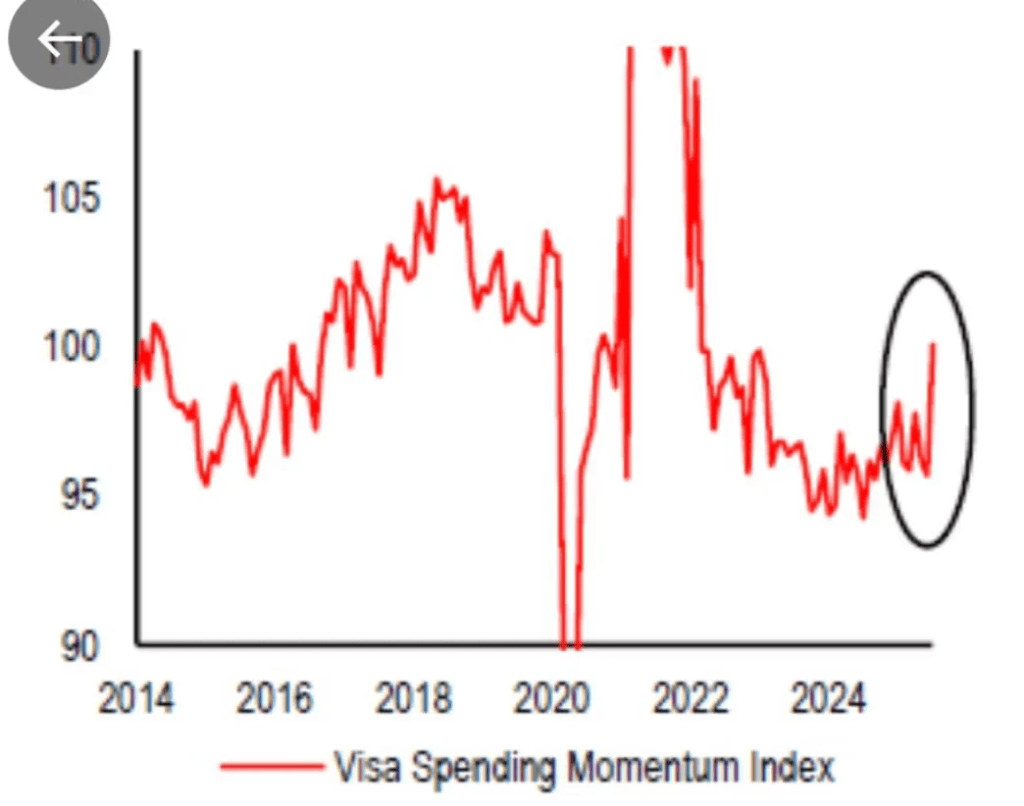
- Credit card delinquencies continue to decline while VISA consumer spending momentum index continues on an uptrend.
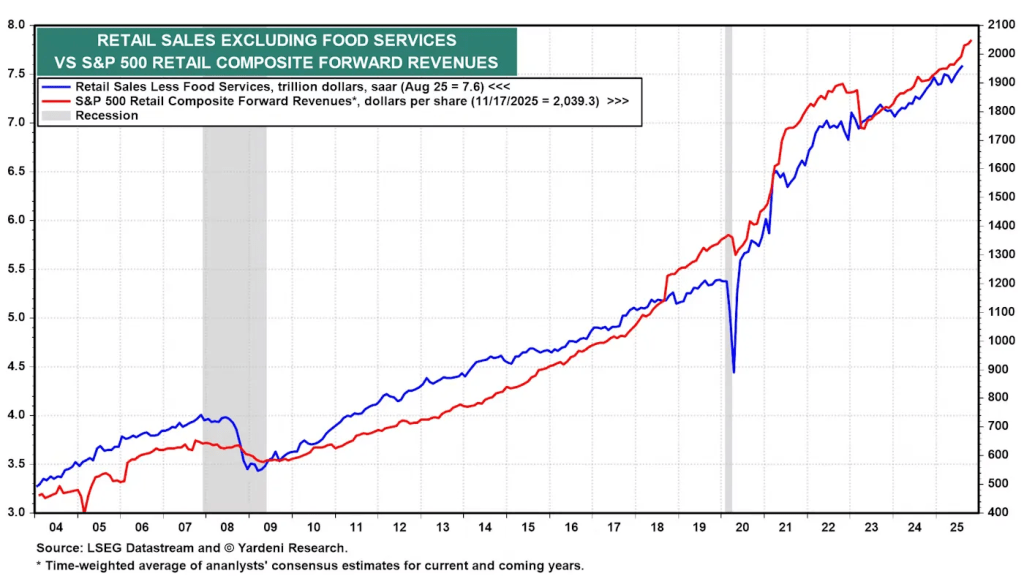
3. S&P 500 retail composite continues to hit ATHs.
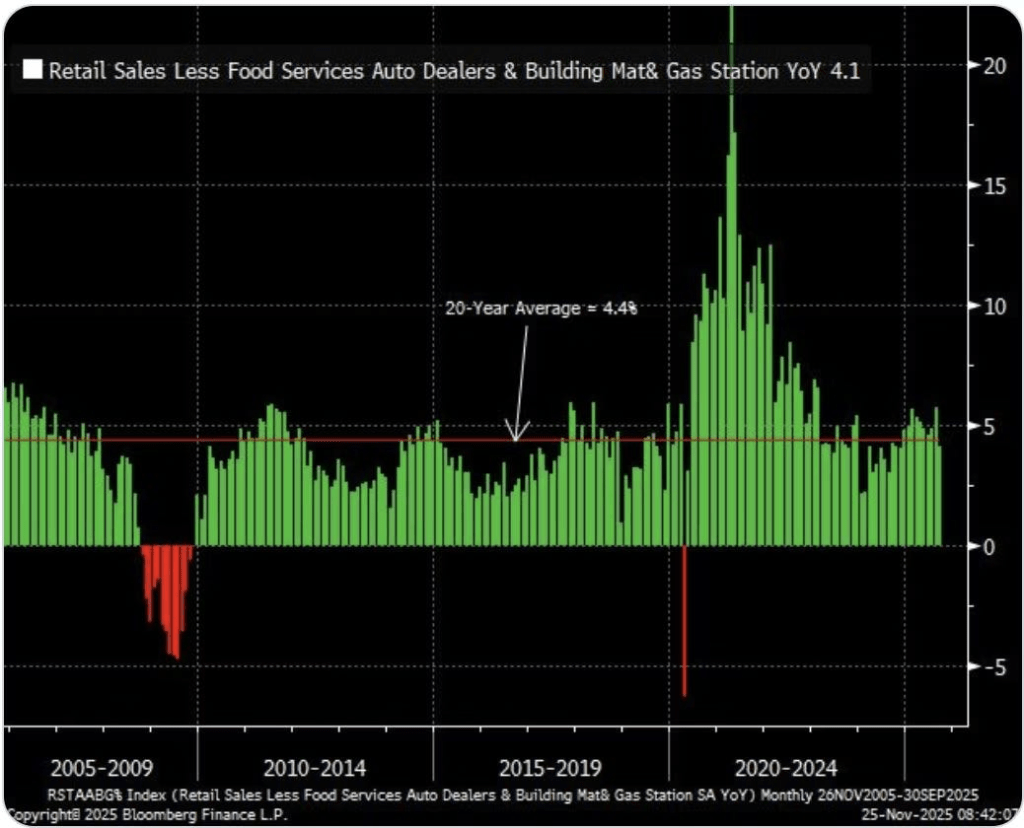
4. Retail sails currently still sit around the 20 year average.
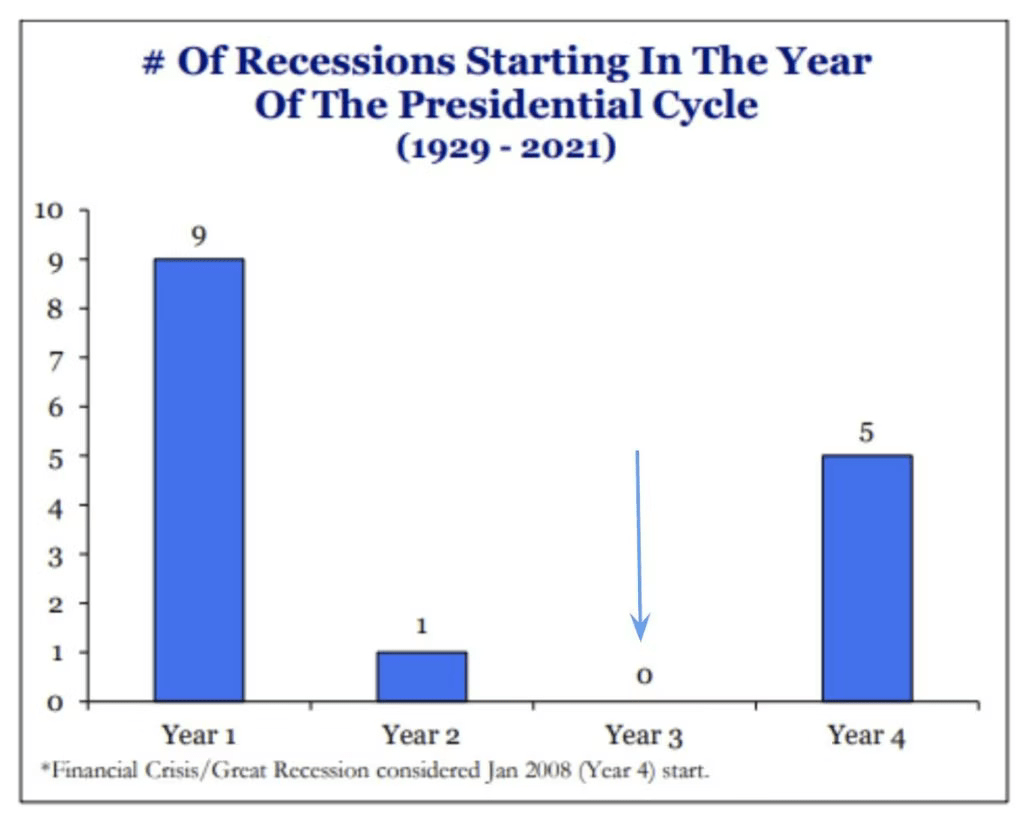
5. Likelihood of recession occurring during a mid-term year is low.
So far, none of these factors are pointing towards recessionary risks. We are, however, currently in a K-shaped economy.
It describes a split in the economy where higher income households increase spending, while lower income households are struggling financially.
Looking at the YoY change in hourly wage across these two segments, we see evidence of this occurring where hourly wages of lower earners are disproportionately reduced.
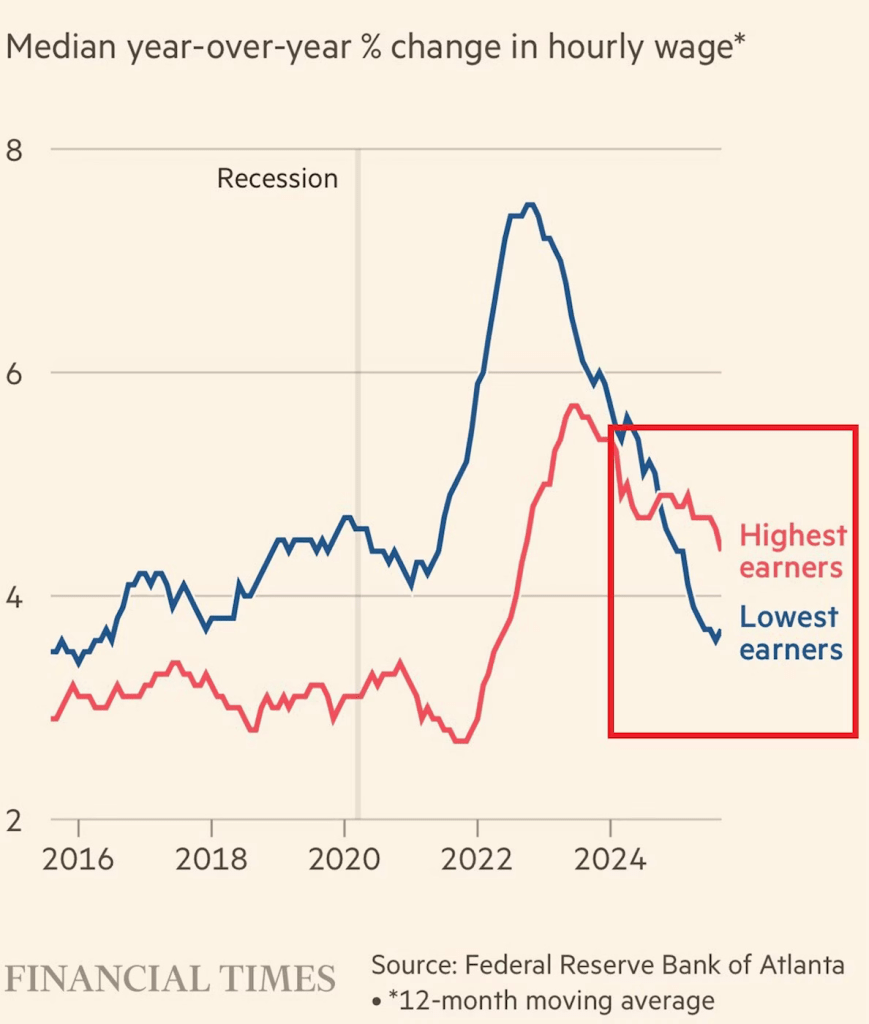
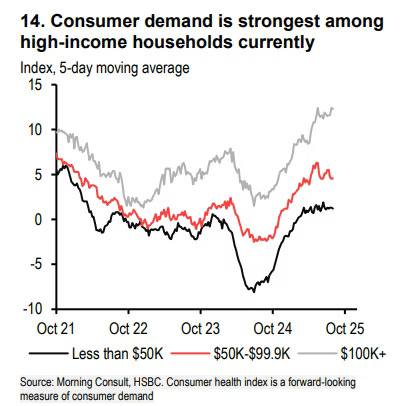
The higher income households continue to spend aggressively on services, propping up the broader economy and labor market. Meanwhile, lower household incomes are pulling back due to living cost struggles.
This means if an external factor causes the higher-income demographic to suddenly slash spending, the primary pillar of current GDP growth would collapse, significantly spiking recession odds.
Are we in an AI Bubble?
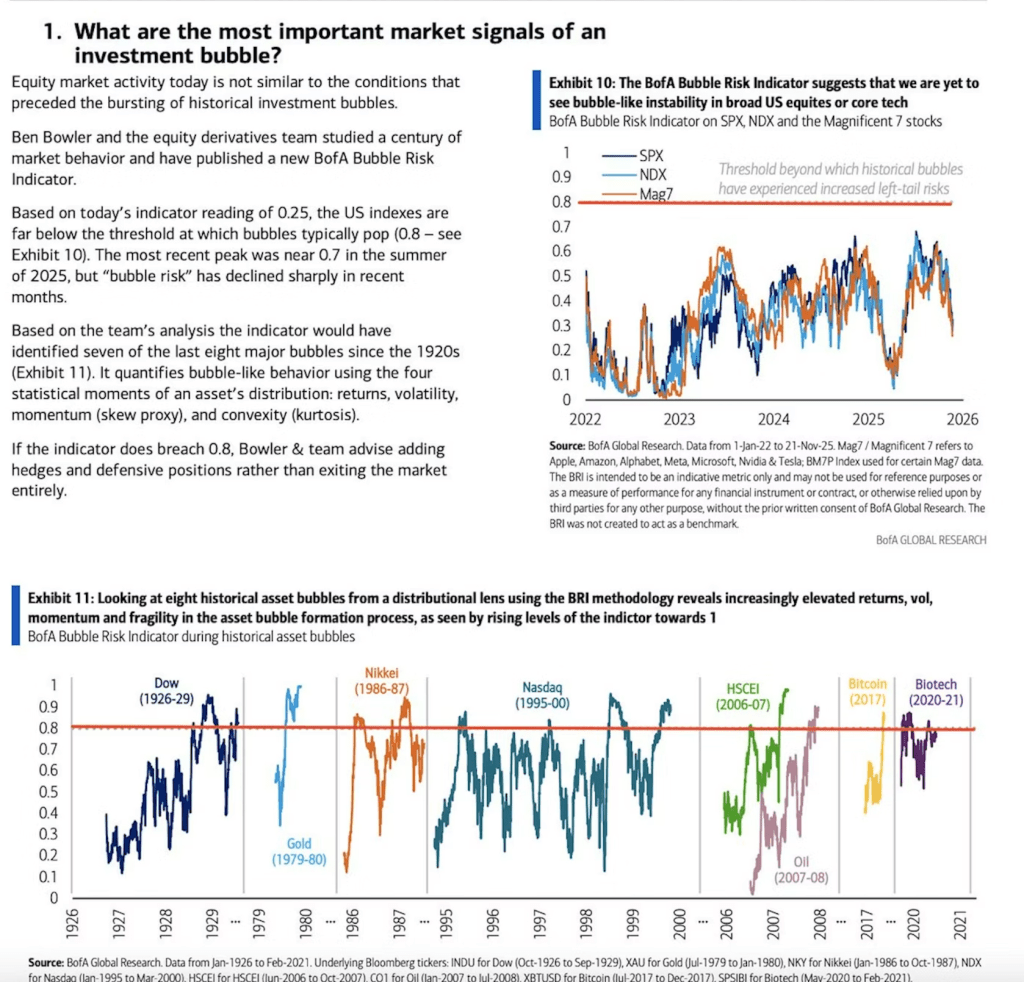
The BofA’s Bubble Risk Indicator has managed to identify 7 of the 8 major bubbles since the 1920s.
According to the indicator, bubbles typically pop once the indicator reading exceeds a value of 0.8.
As of today, the indicator reading sits at 0.25, far below the threshold of a burst bubble.
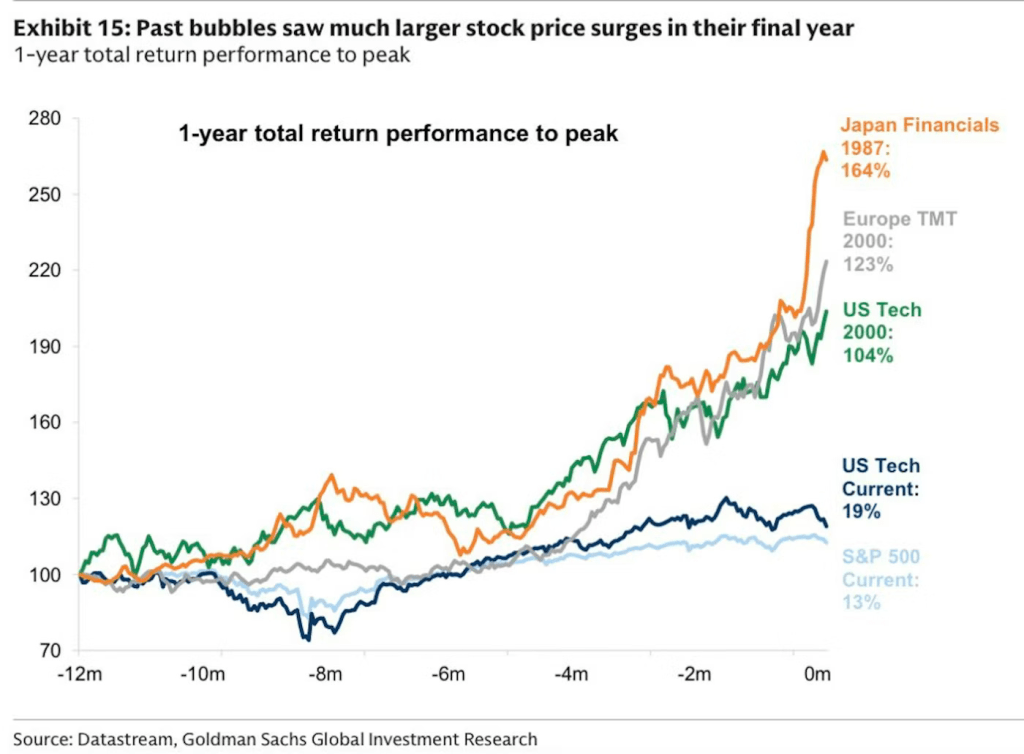
In addition, Goldman Sachs has shown that price action is typically parabolic in the final year of a bubble, which is certainly not the current case.
Conclusion
As previously mentioned, a high probability bet would be to allocate a higher % of cash prior to May to prepare for volatility, and redeploy that cash in November post midterms.
The success of this strategy hinges on Fed monetary policy:
If rate cuts occur, we are likely to end the year positive as recessionary and bubble risks remain low.
If rate hikes occur due to reinflation, we can expect to end the year negative.
(UPDATE MARCH 2026: IRAN WAR)
High oil prices increases transportation and manufacturing costs, which is passed on to the consumers. This pressures the Fed to keep interest rates high to prevent inflation.
On the other hand, high energy prices leaves consumers with less discretionary income. This makes businesses lose money, which can lead to layoffs. To prevent a recession and unemployment, the Fed usually lowers interest rates.
The Fed is caught in a trap because they can’t do both at once:
- If they raise rates to fight the high oil prices, they might cause a recession.
- If they lower rates to help the economy, they might make inflation even worse.
The Fed is currently holding rates steady while they assess whether the oil spike is just a temporary panic or a permanent change.
