An options positioning chart helps us anticipate the support/resistance level of a stock.
This is largely based on the Gamma Exposure (GEX), which dictates how market makers adjust their delta hedging to remain neutral.
Let us go through on how we can apply a GEX chart in practice:
Y-Axis: Shows the Strike Price.
X-Axis: Shows GEX. Calls are on the left, and puts are on the right.
Outlook
First, we’ll take a look at how to identify whether the general outlook for a stock is bullish, neutral, or bearish.
Bullish
Call options dominate. Market makers will be forced to buy the underlying stock to remain delta neutral. This is likely to drive the stock price up.
Neutral
Position is balanced between call and put options. Overall, we can expect range-bound and choppy performance.
Bearish
Put options dominate. Market makers will be forced to sell the underlying stock to remain delta neutral. This is likely to drive the stock price down.
Timeframe
Now that we can identify the general trend, let’s look at the role timeframes play in a GEX chart.
Generally, you don’t want too short of a timeframe as price action is unreliable. On the contrary, too long of a timeframe is irrelevant for near term action.
A 30 to 50 DTE window is ideal because it spans the next OPEX.
50 DTE
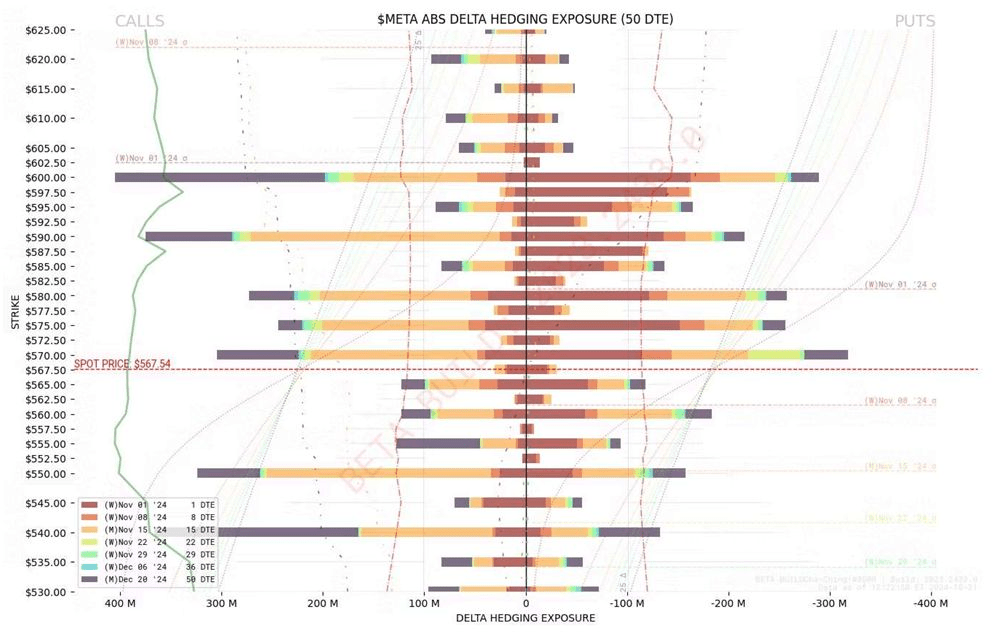
Position for META is neutral in the short term.
190 DTE
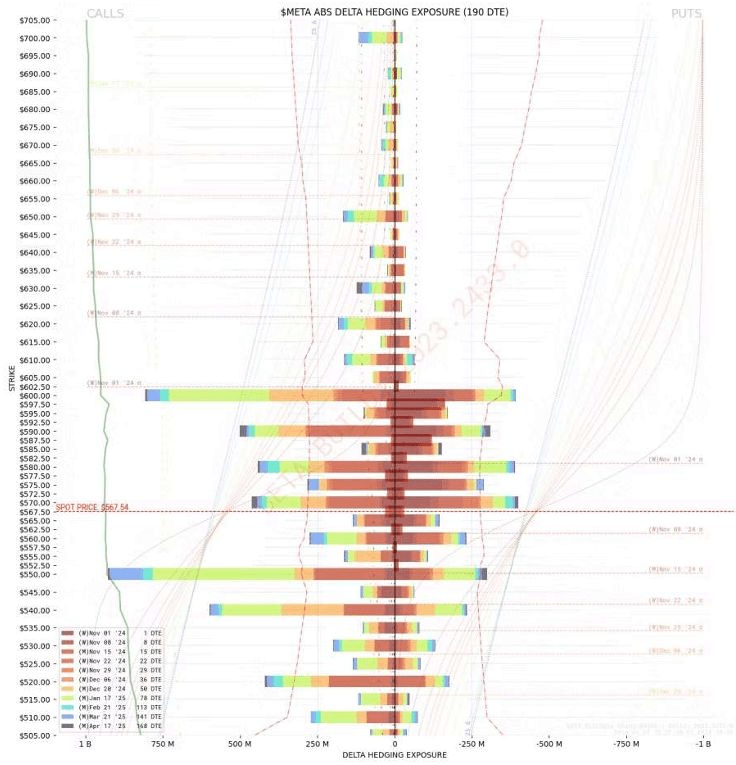
Position for META bullish in the long term.
Overall, we can expect META to chop when trading on a short timeframe, but the price is likely to increase on a longer timeframe.
Price Movement
When a stock contains a massive node, there is a “magnet effect” which sees the stock highly likely to get pinned at said nodes. At these nodes, market makers are forced to rapidly trade millions of shares back and forth just to stay neutral.
As such, this makes it incredibly difficult for the stock price to slice cleanly through that level. In other words, it gets pinned there.
We can assign different type of nodes with the respective functions:
| Option Nodes | Function |
|---|---|
| OTM Call Nodes | Price Target |
| ITM Call Nodes | Support |
| OTM Put Nodes | Bottom |
| ITM Put Nodes | Resistance |
ITM Call Nodes (Support)
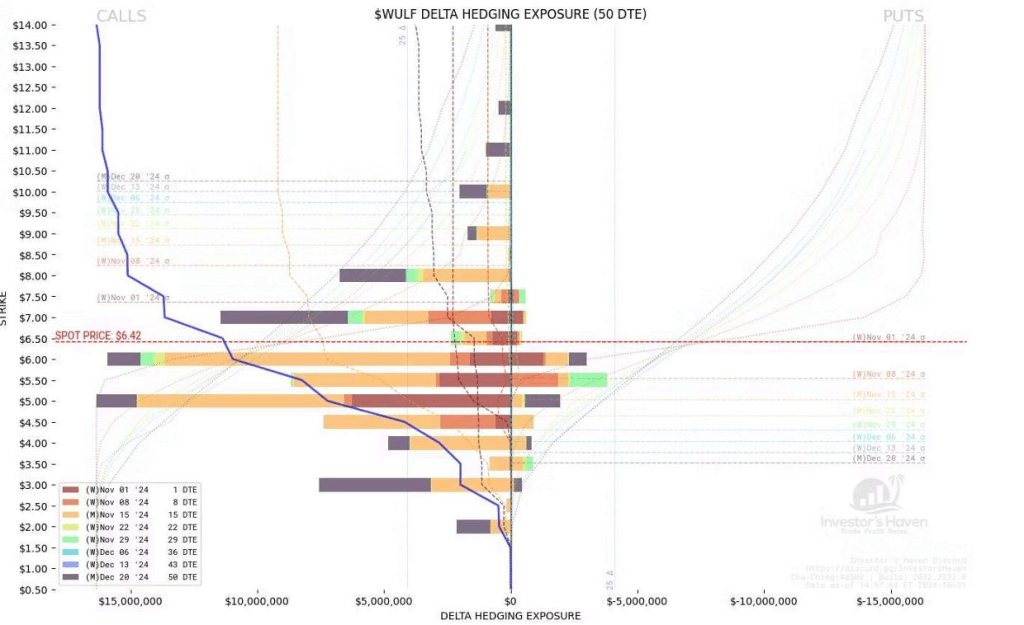
Bullish outlook. Spot price is $6.42. We see huge ITM call nodes at $5 and $6. This reduces the probability of a sharp pullback and we can expect the stock to be supportive at these prices as the stock is pinned at these levels.
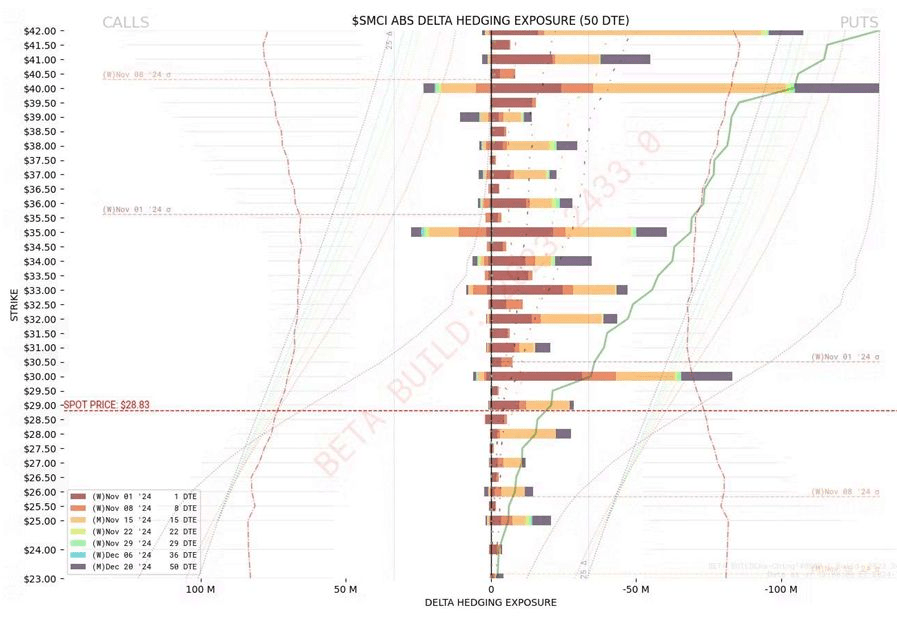
OTM Call Nodes (Price Target)
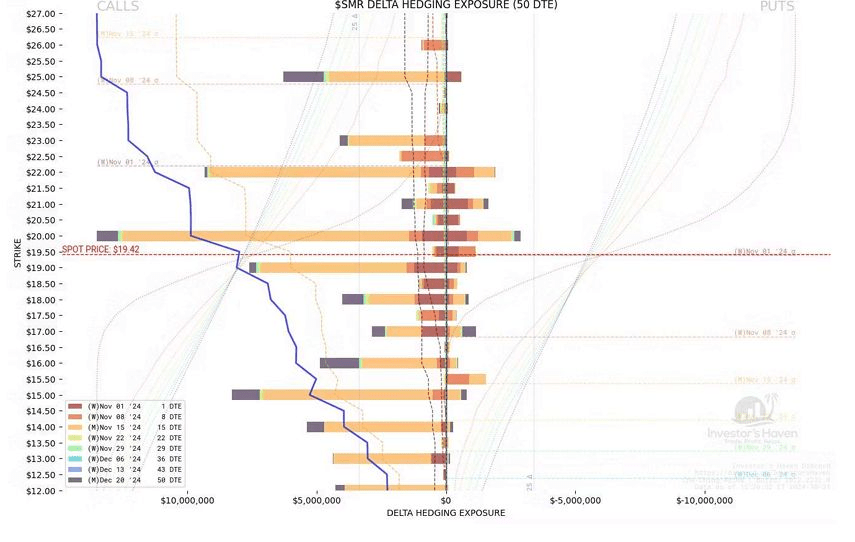
Bullish outlook. Spot price is $19.42. We see huge OTM call nodes at $20, $22 and even $25. This means traders expect the stock’s price to strike above these prices. We can use these nodes as our take-profit points as the price is likely to be pinned here, limiting upside.
If an external catalyst causes the stock to smash through the call wall at $20, a gamma squeeze will occur and the stock will likely jump towards $22 and eventually $25. This is because the delta of the option increases, which forces market makers to buy even more underlying stock to hedge.
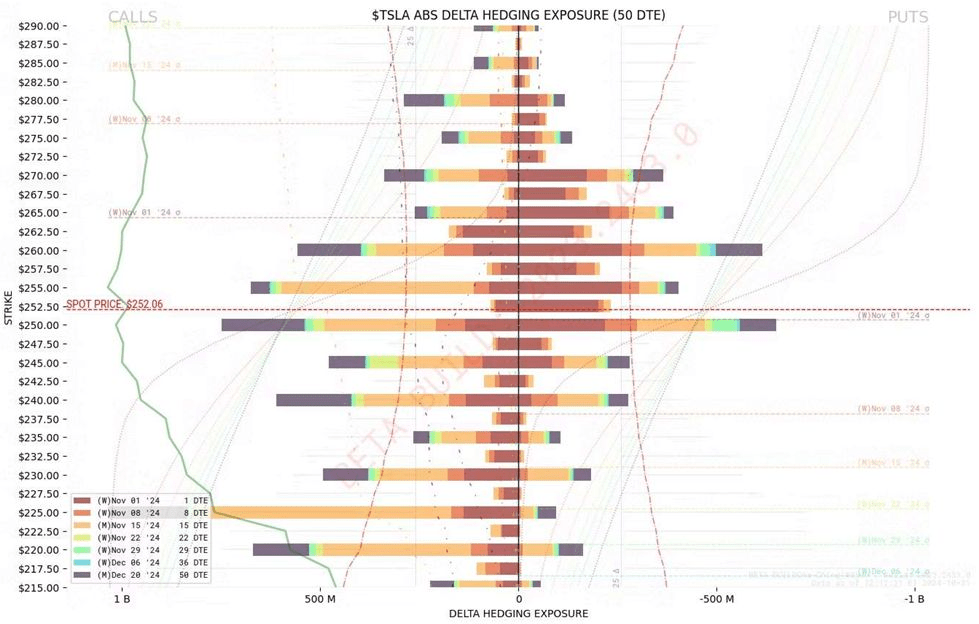
ITM Put Nodes (Resistance)
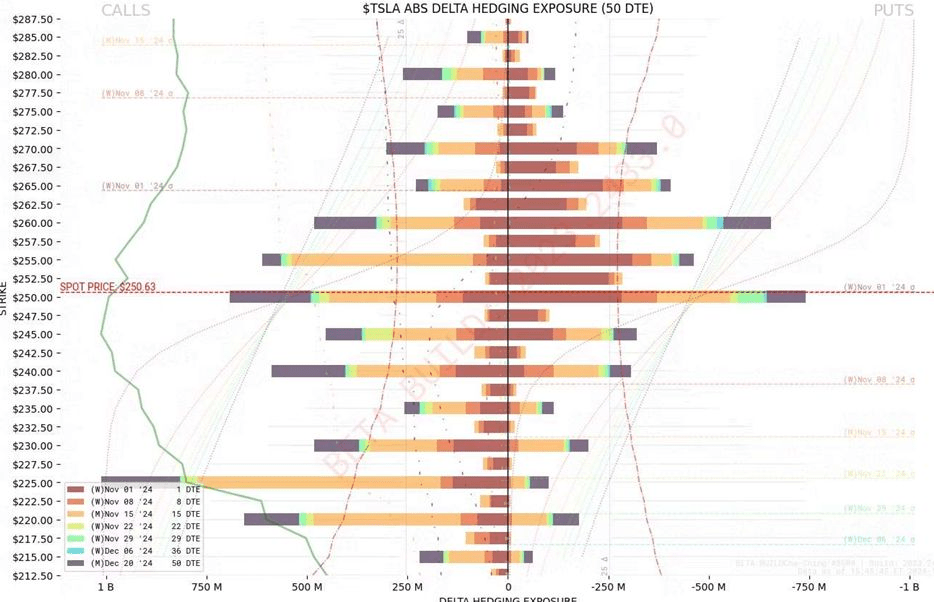
Balanced outlook. Spot price is $250.63. We can see ITM put nodes at $255 and $260, which means we can expect resistance at these prices as the stock is pinned at these levels.
If the stock price rises from $250 toward $255, the puts becomes less valuable and the delta decreases, which forces market makers to sell the underlying stock to hedge, which limits upside.
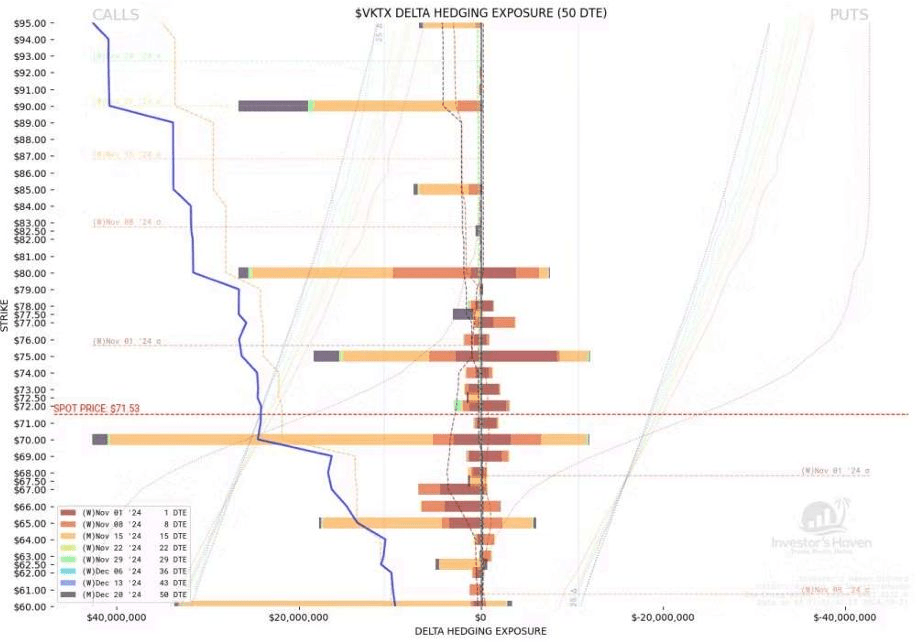
OTM Put Nodes (Bottom)
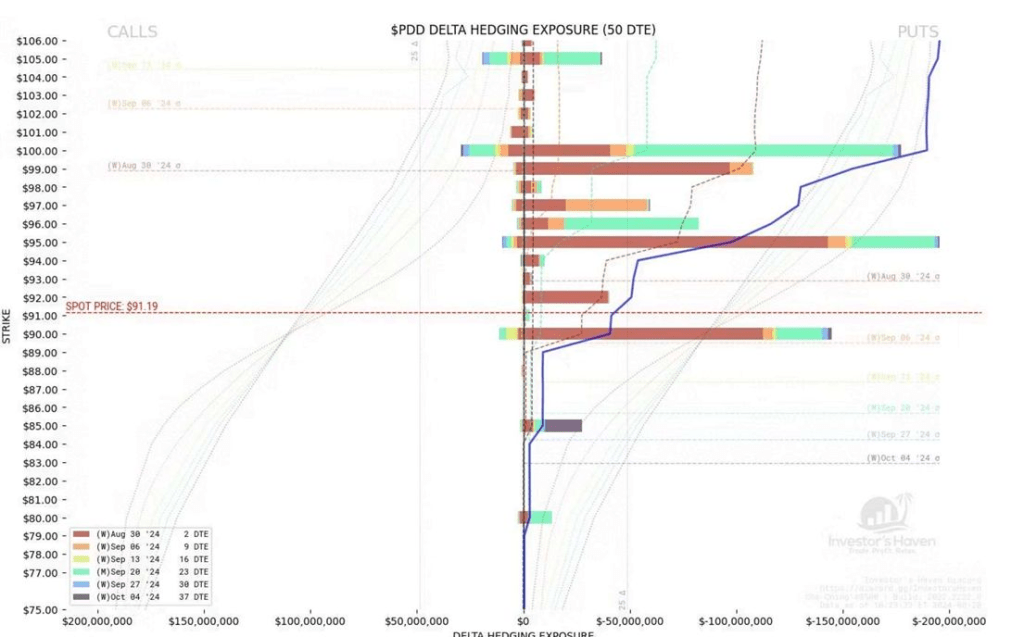
Bearish outlook. Spot price is $91.19. We can see OTM put nodes falls off beyond $90. We can use this as a buy-in price as traders do not expect any further downside beyond $90.
The downside is limited because if the price were to drop from $90 to $85, market makers are not mathematically forced to sell underlying stock as a hedge due to the lack of put contracts requiring it below $90.
