Some people describe Technical Analysis as “astrology”.
However, I believe technical analysis to be an indicator of market mentality. When there is a general consensus of a common indicator, it becomes a self-fulfilling prophecy.
Take the 200-day SMA as an example. Because the entire market views it as major support, traders and algorithms stack their buy orders at that exact level. Ultimately, the support is materialized because of the sheer buying pressure. The belief creates the reality.
In addition, algorithms are coded to trigger buys or sells when specific technical levels are met.
So technical analysis is the study of market psychology. However, I would never base a trade solely off technical analysis. The fundamentals always comes first.
How to trade breakouts?
There are two type of resistances:
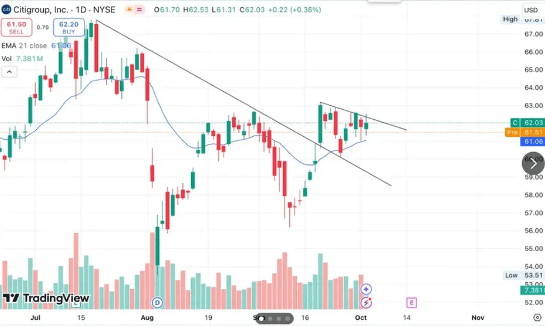
Diagonal (Trendline)
Horizontal
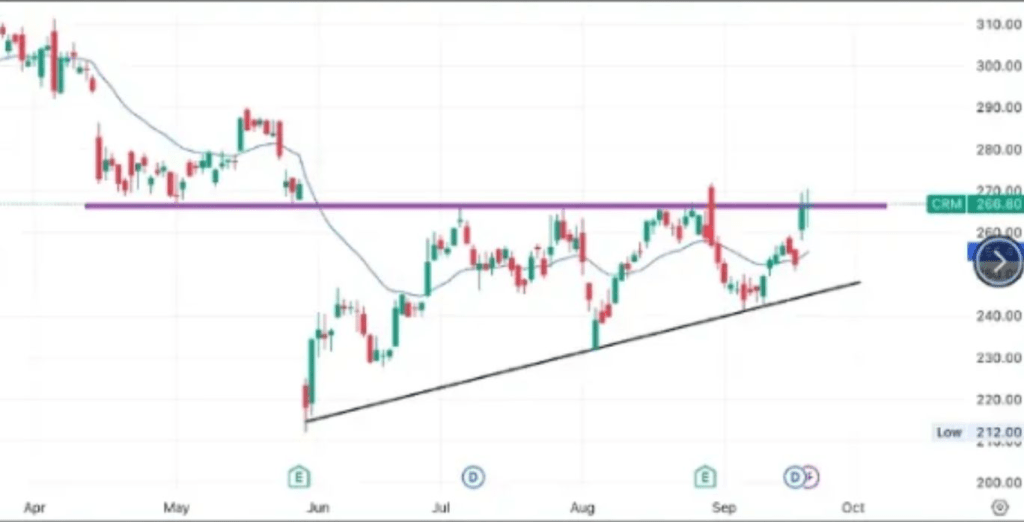
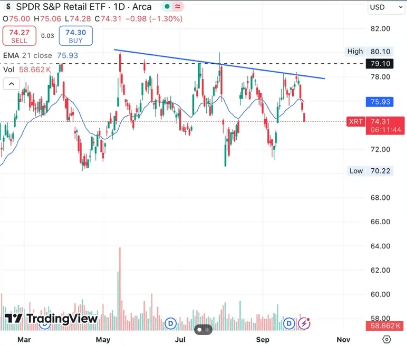
- The more times a resistance is tested, the more reliable they are and likely to break. High volume is required to break a resistance.
- Once a stock has broken out, wait for the stock to close above its resistance.
- Choose the best entry point:
Worst
Not waiting for a stock to close above its resistance. There is a risk of rejection.
Good
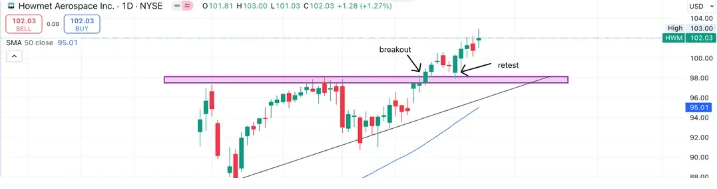
Waiting for a stock to close above its resistance. Once we close above, this adds a lot of upward volume and momentum into the stock. The original resistance turns into a support.
Best
Wait for the stock to successfully retest its new support.
4. Take note of the volume during the breakout and retest phase.
| Bad | Low Volume Breakout High Volume Retest |
| Good | High Volume Breakout Low Volume Retest |
5. If it breaks the SMA in addition, this is a sign of a reliable breakout.

Leave a comment